Introduction
Welcome to the world of Fathom Smart Reporting within QuickBooks Online Advanced! In today’s fast-paced business world, having access to powerful reporting tools is crucial for making informed decisions and driving growth. Fathom Smart Reporting is a feature-rich tool that allows users to analyze their financial data, generate insightful reports, and gain valuable business intelligence.
With Fathom, you can unlock your company’s financial performance and gain valuable insights into key areas such as profitability, cash flow, and growth trends. Whether you’re a small business owner, a finance professional, or an analyst, Fathom Smart Reporting provides you with the tools you need to truly understand the financial health and performance of your business.
By integrating seamlessly with QuickBooks Online Advanced, Fathom Smart Reporting empowers users to effortlessly access and analyze their financial data. It offers a wide range of reporting options, including customizable reports, dynamic dashboards, and interactive visualizations.
Through this comprehensive guide, we will explore how to access and utilize Fathom Smart Reporting within QuickBooks Online Advanced. You’ll learn how to navigate the tool’s features, create customized reports, and share your insights with others. Additionally, we’ll delve into some advanced features and troubleshooting tips to ensure a seamless experience.
By the end of this guide, you’ll be equipped with the knowledge and skills needed to harness the full potential of Fathom Smart Reporting. So, let’s dive in and discover how this powerful tool can revolutionize the way you analyze and interpret your financial data!
Understanding Fathom Smart Reporting
Before we delve further into accessing and utilizing Fathom Smart Reporting within QuickBooks Online Advanced, it’s important to understand the core concepts and functionalities of this powerful tool.
Fathom Smart Reporting is designed to help businesses gain valuable insights into their financial data through comprehensive reporting and analysis. It enables users to transform raw financial data into visually appealing reports and dashboards that provide a clear understanding of the company’s financial performance.
With Fathom, you can easily analyze key financial metrics, such as revenue, expenses, profitability, and cash flow. It offers a range of standard reports and customizable templates that enable you to focus on the specific aspects of your business that matter most to you.
One of the key advantages of Fathom is its ability to consolidate data from multiple sources. It seamlessly integrates with QuickBooks Online Advanced, allowing you to pull data from multiple companies or subsidiaries into a single consolidated view. This makes it easier to compare and analyze financial performance across different entities.
Fathom Smart Reporting also offers a variety of visualizations, such as charts, graphs, and KPIs. These visual representations provide a quick and intuitive way to identify trends, patterns, and anomalies in your financial data. Whether you’re looking to track monthly revenue growth, analyze expense trends, or monitor the performance of specific product lines, Fathom’s visualizations make it easy to spot opportunities and challenges.
Furthermore, Fathom allows you to create custom metrics and calculations based on your unique business needs. You can define your own formulas, ratios, and indicators to gain deeper insights into the financial aspects that are most relevant to your industry or business model.
By leveraging Fathom Smart Reporting, you can go beyond traditional financial reports and dive into the details that truly impact your bottom line. With its user-friendly interface and powerful analytics capabilities, Fathom empowers businesses to gain a comprehensive understanding of their financial performance and make data-driven decisions that drive growth.
In the next section, we will explore how to access Fathom Smart Reporting within QuickBooks Online Advanced and take full advantage of its capabilities. So, let’s continue our journey and unlock the power of Fathom!
Accessing Fathom Smart Reporting in QuickBooks Online
Accessing and using Fathom Smart Reporting within QuickBooks Online Advanced is a straightforward process that enables you to effortlessly analyze your financial data. Let’s explore the steps to access Fathom Smart Reporting:
1. Log in to your QuickBooks Online Advanced account using your credentials.
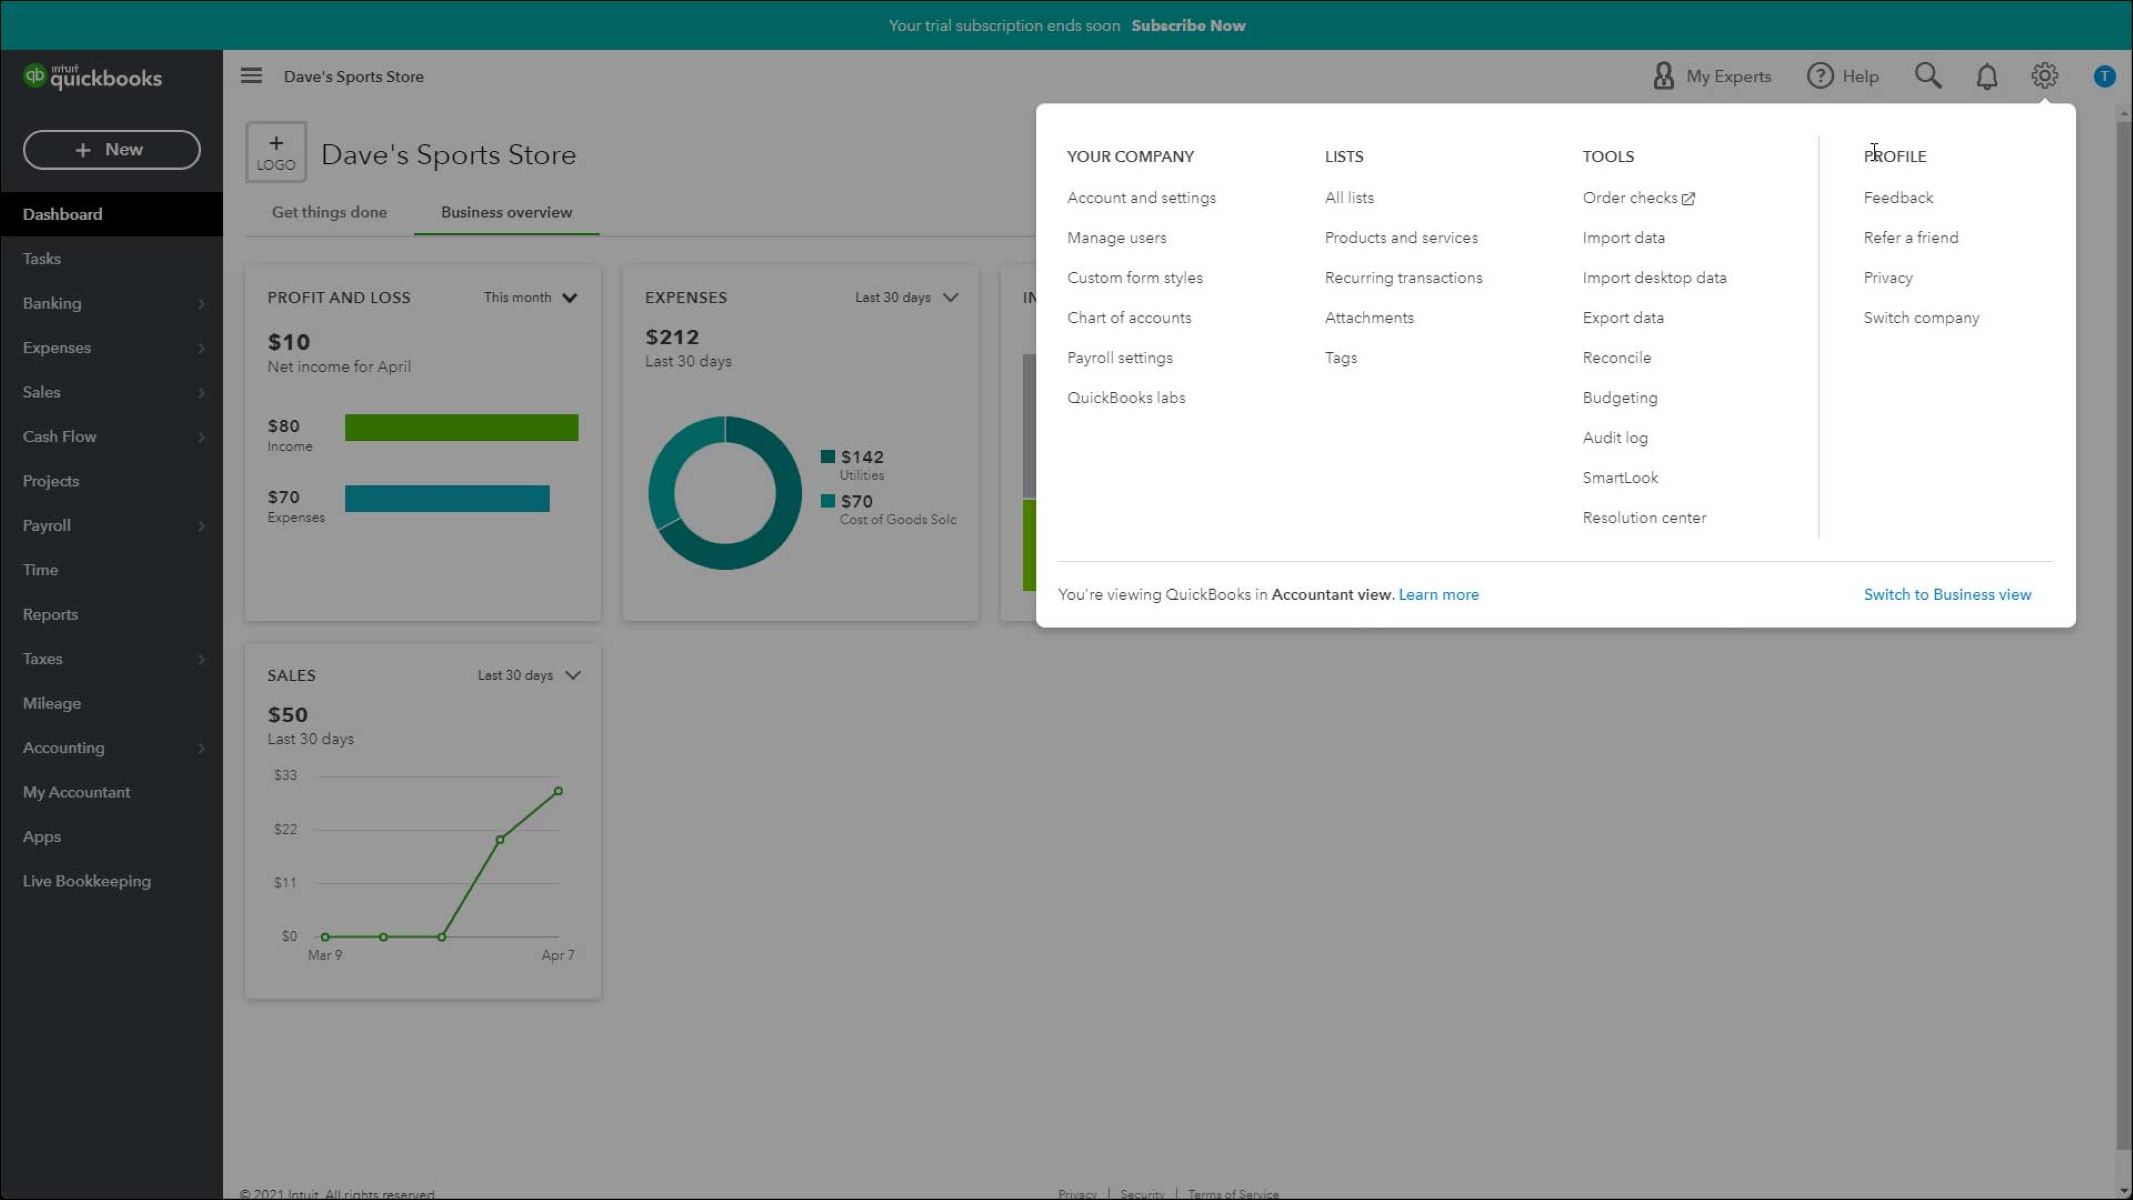
2. Once you’ve logged in, navigate to the “Reports” tab in the main menu.
3. In the Reports menu, you’ll find several options. Look for the “Fathom” option and click on it.
4. Upon clicking the “Fathom” option, you will be redirected to the Fathom Smart Reporting interface.
5. If you’re accessing Fathom Smart Reporting for the first time, you may need to grant permission to allow QuickBooks Online Advanced to integrate with Fathom. Follow the on-screen prompts to authorize the integration.
6. After granting authorization, you can start exploring the various features and capabilities of Fathom Smart Reporting.
Once inside Fathom Smart Reporting, you’ll have access to a wealth of reports, dashboards, and tools to analyze your financial data. The interface is designed to be user-friendly, with intuitive navigation and clear options to help you make the most of this powerful tool.
It’s worth noting that Fathom Smart Reporting is an add-on feature within QuickBooks Online Advanced and may require an additional subscription. Make sure to check your subscription plan to ensure that Fathom Smart Reporting is included or to upgrade if necessary.
Now that you’re familiar with how to access Fathom Smart Reporting within QuickBooks Online Advanced, let’s move on to exploring the various reports and dashboards that are available to help you gain valuable insights into your financial performance.
Fathom Reports & Dashboards
Fathom Smart Reporting offers a comprehensive range of reports and dashboards that enable you to analyze your financial data in a visually appealing and intuitive manner. Let’s take a closer look at the main types of reports and dashboards available:
1. Financial Reports: Fathom provides a variety of standard financial reports, including income statements, balance sheets, cash flow statements, and more. These reports offer a detailed overview of your company’s financial performance, allowing you to track revenue, expenses, profitability, and cash flow over time.
2. KPI Dashboards: Fathom’s KPI (Key Performance Indicator) dashboards provide a snapshot of your company’s key metrics and performance indicators. These dashboards present data in a visually engaging format, allowing you to quickly identify trends, spot outliers, and track progress towards your business goals.
3. Trend Analysis: Fathom allows you to analyze your financial data over time. With trend analysis reports, you can easily identify growth patterns, seasonal fluctuations, and other trends that can impact your business. This information can be invaluable for making insightful decisions and optimizing your business strategy.
4. Benchmarking: Fathom offers benchmarking reports that enable you to compare your company’s financial performance to industry averages and peers. This helps you gain a broader perspective on how your business is performing and identify areas for improvement.
5. Custom Reports: In addition to the standard reports, Fathom allows you to create custom reports tailored to your unique business needs. You can select the specific metrics, calculations, and visualizations that are most relevant to your industry or business model. This level of customization provides a deeper understanding of your financial performance.
Whether you’re looking to review high-level financial statements, track specific KPIs, or perform in-depth analysis, Fathom’s reports and dashboards provide you with the insights you need to make informed decisions.
Furthermore, Fathom offers interactive features within its reports and dashboards, allowing you to drill down into the underlying data and explore specific transactions or accounts. This level of detail helps you identify the root causes of financial trends or anomalies and take appropriate action.
Now that we understand the different types of reports and dashboards available in Fathom, let’s explore how you can create and customize these reports to suit your specific business requirements in the next section.
Creating and Customizing Fathom Reports
One of the key advantages of Fathom Smart Reporting is the ability to create and customize reports that align with your specific business needs. Let’s explore the steps to create and customize Fathom reports:
1. Start by accessing Fathom Smart Reporting within QuickBooks Online Advanced, as discussed in the previous section.
2. Once you’re in the Fathom interface, click on the “Reports” tab to view the available report templates.
3. Select the report template that closely matches the type of report you want to create. For example, if you’re looking to analyze your company’s profitability, select a template like the “Profitability Analysis” report.
4. After selecting a template, customize it to match your specific requirements. You can modify the report’s layout, add or remove data columns, adjust time periods, and select the metrics you want to include.
5. Fathom also allows you to create custom metrics and calculations to gain deeper insights. You can define formulas and ratios based on your unique business needs.
6. Once you’ve customized the report to your satisfaction, you can save it for future use or generate it instantly to view the results.
7. Fathom reports can be exported in various formats, such as PDF, Excel, or HTML, giving you the flexibility to share and distribute them as needed.
Additionally, Fathom provides options to schedule automatic report generation. This feature allows you to set up recurring reports and have them delivered to your email inbox at regular intervals, saving you time and ensuring you stay up to date with your financial performance.
With the ability to create and customize reports, Fathom empowers you to focus on the specific financial aspects that matter most to your business. Whether you need to track product line performance, measure marketing campaign ROI, or analyze cost drivers, Fathom’s customization options enable you to get the insights you need.
By creating customized reports, you can present financial information in a format that is easily understandable and actionable. This enables you and your team to make informed decisions and drive business growth.
Now that we’ve covered the process of creating and customizing Fathom reports, let’s move on to the next section and explore how you can share these reports with others.
Sharing Fathom Reports with Others
Once you have created and customized your Fathom reports, you may want to share them with team members, stakeholders, or clients. Fathom provides several options for sharing reports and collaborating with others. Let’s explore how to share Fathom reports:
1. Exporting Reports: Fathom allows you to export reports in various formats, such as PDF, Excel, or HTML. You can export the reports to your local device and share them via email or file-sharing platforms. This is a simple and effective way to distribute reports to others for review and analysis.
2. Scheduled Delivery: Fathom offers scheduled report delivery options. You can set up automated report generation and have the reports sent to designated recipients on a regular basis. This is particularly useful for sharing reports with stakeholders who need ongoing access to the latest financial information.
3. Collaborative Access: Fathom provides collaborative access to reports, allowing team members or clients to view and interact with the reports in real-time. You can invite others to access Fathom and assign them specific permissions, such as view-only access or the ability to modify reports. This facilitates collaboration and fosters a more efficient and collaborative decision-making process.
4. Dashboards for Real-Time Sharing: Fathom’s interactive dashboards can be shared with others through secure links. This enables stakeholders to access and explore the latest financial data in a user-friendly and visually appealing format. With real-time access to dashboards, everyone can stay informed and make data-driven decisions.
5. Integration with Online File-Sharing Platforms: Fathom integrates with popular file-sharing platforms like Dropbox and Google Drive. You can save Fathom reports to these platforms and share them directly with others. This ensures that the reports are easily accessible and can be shared with individuals outside of the Fathom system.
By leveraging these sharing options, you can ensure that the right people have access to the relevant financial information. Sharing Fathom reports promotes transparency and collaboration within your organization, allowing everyone to stay aligned and make informed decisions based on the same consistent data.
Now that we’ve explored how to share Fathom reports, let’s move on to the next section and uncover some of the advanced features and functionalities offered by Fathom Smart Reporting.
Advanced Features of Fathom Smart Reporting
Fathom Smart Reporting offers a range of advanced features and functionalities that enhance your ability to analyze financial data and extract valuable insights. Let’s delve into some of the advanced features that make Fathom a powerful tool for financial reporting:
1. Advanced Calculations and Metrics: Fathom allows you to create complex calculations and metrics based on your unique business needs. You can define formulas, ratios, and indicators to measure the financial aspects that are most relevant to your industry or business model. This level of customization provides a deeper understanding of your financial performance.
2. Consolidation of Data: Fathom seamlessly consolidates data from multiple companies or subsidiaries, giving you a holistic view of your financial performance. This is particularly useful for businesses with multiple entities or franchise operations, as it simplifies the process of comparing and analyzing data across different entities.
3. What-If Analysis: Fathom enables you to perform what-if analysis by allowing you to create multiple scenarios and simulate the impact on your financials. You can adjust variables such as sales volume, pricing, or expenses to see how different scenarios would affect your profitability and cash flow. This feature helps you evaluate the potential outcomes of various business decisions or changes in market conditions.
4. Interactive Dashboards: Fathom’s interactive dashboards provide real-time visualizations of key financial metrics and performance indicators. These dashboards allow you to drill down into the underlying data, explore trends, and identify opportunities or challenges. The ability to interact with the data in a meaningful way empowers you to make data-driven decisions quickly and effectively.
5. Scheduled Alerts: Fathom offers scheduled alerts that notify you when specific financial thresholds or KPIs are exceeded. This feature allows you to stay proactive and address issues promptly. Whether it’s monitoring cash flow, profit margins, or revenue targets, scheduled alerts keep you informed and ensure that you can take immediate action when necessary.
6. Customizable Dashboards: In addition to the pre-built dashboards, Fathom allows you to create custom dashboards tailored to your specific needs. You can choose the metrics, charts, and visualizations that matter most to your business and arrange them in a way that suits your preferences. Customizable dashboards provide a personalized view of your financial data and make it easier to focus on the most critical aspects of your business.
With these advanced features, Fathom Smart Reporting takes your financial analysis to the next level. By leveraging these functionalities, you can gain deeper insights, perform sophisticated analysis, and make well-informed decisions that drive business growth.
Now that we’ve explored the advanced features of Fathom Smart Reporting, let’s move on to the final section of our guide, where we will cover some troubleshooting tips to help you overcome any challenges you may encounter while using Fathom.
Troubleshooting Fathom Smart Reporting Issues
While Fathom Smart Reporting is a robust and user-friendly tool, it’s not uncommon to encounter occasional issues or challenges. In this section, we’ll cover some common troubleshooting tips to help you navigate and resolve any problems you may encounter while using Fathom Smart Reporting:
1. Clear Your Browser Cache: If you’re experiencing issues with Fathom, try clearing your browser cache. Accumulated cache data can sometimes interfere with the proper functioning of web-based applications like Fathom. Clearing your cache can help resolve any performance or display issues.
2. Check Your Internet Connection: A stable and reliable internet connection is crucial for accessing and using Fathom. If you’re facing difficulties, ensure that your internet connection is stable, and try refreshing the page or restarting your router if necessary.
3. Update Your Browser: Fathom is designed to work best with the latest versions of popular web browsers. If you’re encountering issues, make sure that your browser is up to date. Updating to the latest version can often resolve compatibility or performance issues.
4. Review Error Messages: If you’re receiving error messages while using Fathom, take note of the specific error details. Error messages may provide clues about the root cause of the issue. Use the error message as a starting point to troubleshoot or search for solutions online.
5. Contact Fathom Support: If you’re unable to resolve the issue on your own, don’t hesitate to reach out to Fathom’s customer support. They have a dedicated team of experts who can assist you in diagnosing and resolving any technical issues you may be facing.
6. Verify Data Integration: If you’re experiencing discrepancies or missing data in your reports, make sure that your QuickBooks Online Advanced integration with Fathom is set up correctly. Double-check the data mapping and ensure that the appropriate data is being synchronized between the two platforms.
7. Explore Fathom’s Help Resources: Fathom provides extensive help documentation, tutorials, and video guides to assist users in resolving common issues. Take advantage of these resources to learn more about the tool’s features and troubleshoot any challenges you may encounter.
By following these troubleshooting tips, you can resolve most common issues that arise while using Fathom Smart Reporting. Remember that ongoing communication with Fathom support and staying updated with the latest software releases and bug fixes can help ensure a smooth experience with the tool.
As we come to the end of our guide, we hope that you have gained valuable insights into accessing, utilizing, and troubleshooting Fathom Smart Reporting within QuickBooks Online Advanced. By harnessing the power of Fathom, you can analyze your financial data, generate meaningful reports, and make informed decisions that drive your business forward.
Conclusion
In conclusion, Fathom Smart Reporting is a powerful tool that enhances your ability to analyze and interpret financial data within QuickBooks Online Advanced. With its range of features, customizable reports, and interactive dashboards, Fathom enables you to unlock the full potential of your financial data and gain valuable insights into your business’s performance.
We started our journey by understanding the fundamentals of Fathom Smart Reporting and how it integrates seamlessly with QuickBooks Online Advanced. We explored how to access Fathom and navigate its user-friendly interface. We then delved into the different types of reports and dashboards available, such as financial reports, KPI dashboards, trend analysis, and benchmarking.
You’ve learned how to create and customize Fathom reports to focus on the specific financial aspects that are most relevant to your business. By customizing reports and utilizing advanced calculations, metrics, and interactive dashboards, you can gain deeper insights and make data-driven decisions.
We also explored the various options for sharing Fathom reports, whether it’s exporting them in different formats, scheduling automatic delivery, or providing collaborative access. Sharing reports promotes transparency, collaboration, and alignment within your organization.
Furthermore, we discussed some advanced features of Fathom Smart Reporting, including data consolidation, what-if analysis, and customizable dashboards. These features allow you to perform sophisticated analysis, gain deeper insights, and stay proactive in monitoring your financial performance.
Lastly, we provided troubleshooting tips to help you address any issues that may arise while using Fathom Smart Reporting. Clearing the browser cache, checking your internet connection, and reaching out to Fathom support are some of the steps you can take to resolve common issues.
By leveraging the capabilities of Fathom Smart Reporting, you can transform raw financial data into meaningful insights and drive your business’s growth. Whether you’re a small business owner, a finance professional, or an analyst, Fathom provides you with the tools you need to make informed decisions and stay in control of your financial performance.
We hope this guide has equipped you with the knowledge and skills to effectively use Fathom Smart Reporting within QuickBooks Online Advanced. Take advantage of the features, customize your reports, collaborate with others, and unlock the power of your financial data with Fathom!