Introduction
When using a Raspberry Pi, monitoring your CPU usage is a crucial aspect to ensure optimal performance and avoid any potential issues. Understanding how your CPU is being utilized can help you identify processes that are consuming excessive resources or causing high load on the system. Fortunately, there are several methods available to check your CPU usage on a Raspberry Pi.
Whether you are a beginner or an experienced user, this guide will walk you through different ways to monitor your CPU usage on a Raspberry Pi. From using the command line to utilizing handy applications, you’ll have the tools you need to keep an eye on your device’s performance.
By regularly monitoring your CPU usage, you can identify if your device is running at its maximum capacity or if there is room for optimization. This knowledge can be particularly useful when running resource-intensive tasks or projects on your Raspberry Pi.
Throughout this guide, we will explore various methods to check your CPU usage, including using the command line, leveraging built-in tools, and even writing a Python script. You can choose the method that best suits your needs and comfort level.
So, let’s dive in and explore these methods in detail, allowing you to effectively monitor your CPU usage on your Raspberry Pi!
Method 1: Using the Command Line
One of the simplest ways to check your CPU usage on a Raspberry Pi is by using the command line. The command line provides a quick and efficient way to gather information about your system, including CPU usage.
To check your CPU usage, open a terminal window on your Raspberry Pi and enter the following command:
topThis will display a live updating list of processes, with the CPU usage percentage for each process. By default, the processes are sorted by their CPU usage, with the most resource-intensive processes displayed at the top of the list. You can press “q” to exit the top command.
The top command provides a real-time overview of your CPU usage, making it easy to identify any processes that might be using a significant amount of resources. It also shows other valuable information, such as memory usage and system uptime.
Another useful command line utility to check your CPU usage is the “uptime” command. Simply enter the following command:
uptimeThis command will display the current system time, how long the Raspberry Pi has been running, and the average CPU load over the past 1, 5, and 15 minutes. It provides a quick snapshot of the CPU usage and system uptime.
Using the command line to monitor CPU usage is an efficient method, especially for users comfortable with navigating the terminal. However, if you prefer a more visual and interactive approach, there are other methods available that provide even more detailed insights into your CPU usage.
Now that you know how to check CPU usage using the command line, let’s explore other methods to monitor your Raspberry Pi’s performance.
Method 2: Using the top Command
Another way to check your CPU usage on a Raspberry Pi is by using the “top” command. The top command provides a dynamic view of the processes running on your system, including their CPU usage.
To use the top command, open a terminal window on your Raspberry Pi and enter the following command:
topOnce executed, you will see an interactive display that shows various system information, including CPU usage. The top command lists all running processes, sorted by their CPU usage in descending order. The process with the highest CPU usage will be displayed at the top.
The top command provides real-time insight into your CPU usage, allowing you to monitor how your Raspberry Pi is performing. You can observe which processes are consuming the most CPU resources and make informed decisions on optimizing your device’s performance.
Within the top command interface, you will find additional useful information such as memory usage, load averages, and process details. You can navigate through the top output by using keyboard shortcuts displayed at the bottom of the screen.
To exit the top command, simply press the “q” key.
Using the top command is a straightforward and efficient method to monitor CPU usage on your Raspberry Pi. It offers a real-time overview of your system’s performance and allows you to quickly identify any processes that may be causing high CPU load.
Now that you know how to check your CPU usage using the top command, let’s explore other methods to monitor your Raspberry Pi’s CPU performance.
Method 3: Using the htop Tool
If you are looking for a more advanced and visually appealing way to check your CPU usage on a Raspberry Pi, the htop tool is an excellent option. htop is an interactive process viewer that provides a more detailed and user-friendly interface compared to the top command.
To use htop, open a terminal window on your Raspberry Pi and enter the following command to install it:
sudo apt-get install htopOnce installed, simply enter the following command to start using htop:
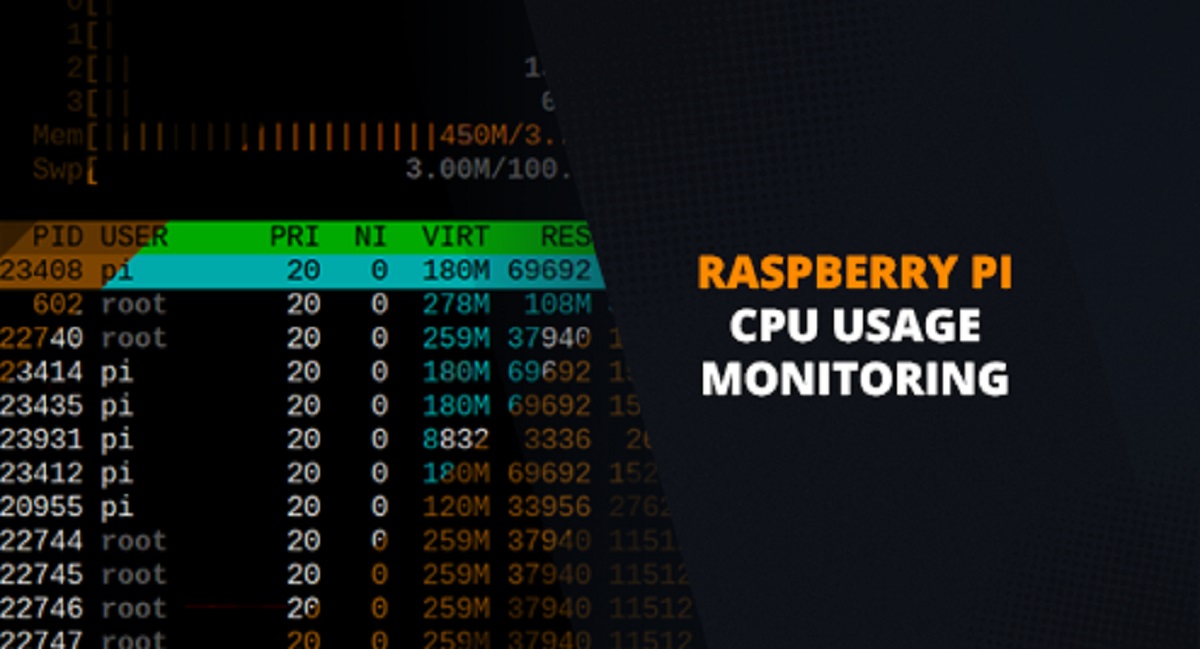
htopUpon execution, htop will display an interactive interface that shows detailed system information, including CPU usage. The processes are sorted by their CPU usage percentage, with the most resource-intensive processes listed at the top.
htop provides a wealth of information, including CPU load averages, memory usage, and a breakdown of CPU usage per core. You can navigate through the process list, manually change the sorting order, and even send signals to individual processes.
htop allows you to dig deeper into your system’s performance, giving you a clear overview of your CPU usage and helping you identify any processes that may be causing high resource consumption.
To exit htop, simply press the “q” key.
The htop tool offers a more interactive and comprehensive way to monitor CPU usage on your Raspberry Pi. Its user-friendly interface and rich features make it a popular choice for users who desire more control and detailed insights into their system.
Now that you know how to check CPU usage using htop, let’s explore other methods to monitor your Raspberry Pi’s CPU performance.
Method 4: Using the System Monitor Application
If you prefer a graphical user interface (GUI) to monitor your CPU usage on a Raspberry Pi, the System Monitor application provides a convenient solution. This pre-installed tool offers a visual representation of system resources, including CPU usage.
To open the System Monitor application, navigate to the menu on your Raspberry Pi’s desktop environment and search for “System Monitor” or select it from the system utilities section.
Once launched, the System Monitor application will display a window with several tabs, including the “Resources” tab. Click on the “Resources” tab to view the CPU usage and other resource information in real-time.
The CPU usage is represented graphically, showing the percentage of CPU usage over time. You can also see the average CPU usage, as well as information about memory usage and network activity.
The System Monitor application offers a user-friendly and intuitive interface for monitoring your Raspberry Pi’s CPU usage. It provides a visual representation that allows you to easily track performance and spot any irregularities that may require attention.
In addition to CPU usage, the System Monitor application can provide valuable insights into other system resources, making it a versatile tool for monitoring overall system health.
Now that you know how to check CPU usage using the System Monitor application, let’s explore other methods to monitor your Raspberry Pi’s CPU performance.
Method 5: Writing a Python Script to Check CPU Usage
If you are comfortable with programming, you can write a Python script to check the CPU usage on your Raspberry Pi. This approach gives you the flexibility to customize the script and integrate it into your own projects or automation workflows.
To get started, create a new Python script using your preferred text editor on your Raspberry Pi. Begin by importing the necessary modules:
import psutilThe psutil module provides an easy and convenient way to retrieve system information, including CPU usage. Next, use the following code to get the CPU usage percentage:
cpu_usage = psutil.cpu_percent(interval=1)In this example, we use the cpu_percent function from the psutil module and specify an interval of 1 second to get the CPU usage percentage. You can adjust the interval based on your specific requirements.
You can then use the cpu_usage variable to perform further actions based on the CPU usage data. For example, you can print the CPU usage or set up conditions to trigger specific actions when the CPU usage exceeds a certain threshold.
By writing a Python script to check CPU usage, you have full control over how the data is processed and utilized. You can incorporate additional functionalities, such as writing the CPU usage to a file, sending notifications, or triggering other actions based on specific scenarios.
Writing a Python script to check CPU usage is a more advanced method, but it gives you the flexibility to monitor your Raspberry Pi’s performance programmatically. It’s a powerful approach if you want to integrate CPU monitoring into your own projects or automate certain tasks based on CPU usage.
Now that you know how to write a Python script to check CPU usage, let’s recap the various methods we’ve explored to monitor your Raspberry Pi’s CPU performance.
Conclusion
Monitoring the CPU usage on your Raspberry Pi is essential for ensuring optimal performance and identifying any resource-intensive processes. Throughout this guide, we have explored several methods to check CPU usage on a Raspberry Pi.
We started by using the command line, which provides a quick and straightforward way to gather CPU usage data using commands like “top” and “uptime.” This method is perfect for users comfortable with the terminal and offers real-time insights into CPU usage.
For those looking for a more comprehensive and interactive experience, we explored the htop tool. With its user-friendly interface and rich features, htop allows you to dig deeper into the CPU usage and gain a better understanding of your system’s performance.
We also discussed using the System Monitor application, which provides a graphical representation of CPU usage and other system resources. This pre-installed tool offers an easy-to-use interface to monitor your Raspberry Pi’s CPU usage without the need for command line interaction.
Lastly, we explored the option of writing a Python script to check CPU usage. This method provides the most flexibility as it allows you to customize the script and incorporate it into your own projects or automation workflows.
By understanding and utilizing these methods, you can effectively monitor your Raspberry Pi’s CPU usage and make informed decisions to optimize its performance.
Remember, keeping an eye on your CPU usage is crucial for maintaining the stability and efficiency of your Raspberry Pi. Whether you prefer a command line approach, a graphical interface, or the flexibility of writing your own Python script, these methods will help you keep your device in top shape.
So go ahead, choose the method that best suits your needs, and start monitoring your Raspberry Pi’s CPU usage today!


