Introduction
Chrome Developer Tools is a powerful set of web development and debugging tools built directly into the Google Chrome browser. Whether you're a seasoned web developer or just starting out, mastering these tools can significantly enhance your productivity and efficiency. From inspecting and modifying the structure and layout of web pages to analyzing network activity and optimizing performance, Chrome Developer Tools offers a comprehensive suite of features to aid in web development and troubleshooting.
These tools are designed to provide developers with deep insights into the inner workings of their web applications, allowing them to identify and resolve issues quickly and effectively. By understanding how to leverage the various panels and functionalities within Chrome Developer Tools, developers can streamline their workflow, improve the quality of their code, and create better user experiences.
In this article, we will explore the key features and functionalities of Chrome Developer Tools, providing a comprehensive guide on how to make the most of this indispensable resource. Whether you're looking to troubleshoot layout issues, debug JavaScript code, optimize network performance, or analyze memory usage, Chrome Developer Tools has you covered. By the end of this guide, you'll have a solid understanding of how to harness the full potential of these tools to elevate your web development skills and deliver exceptional web experiences.
Opening Chrome Developer Tools
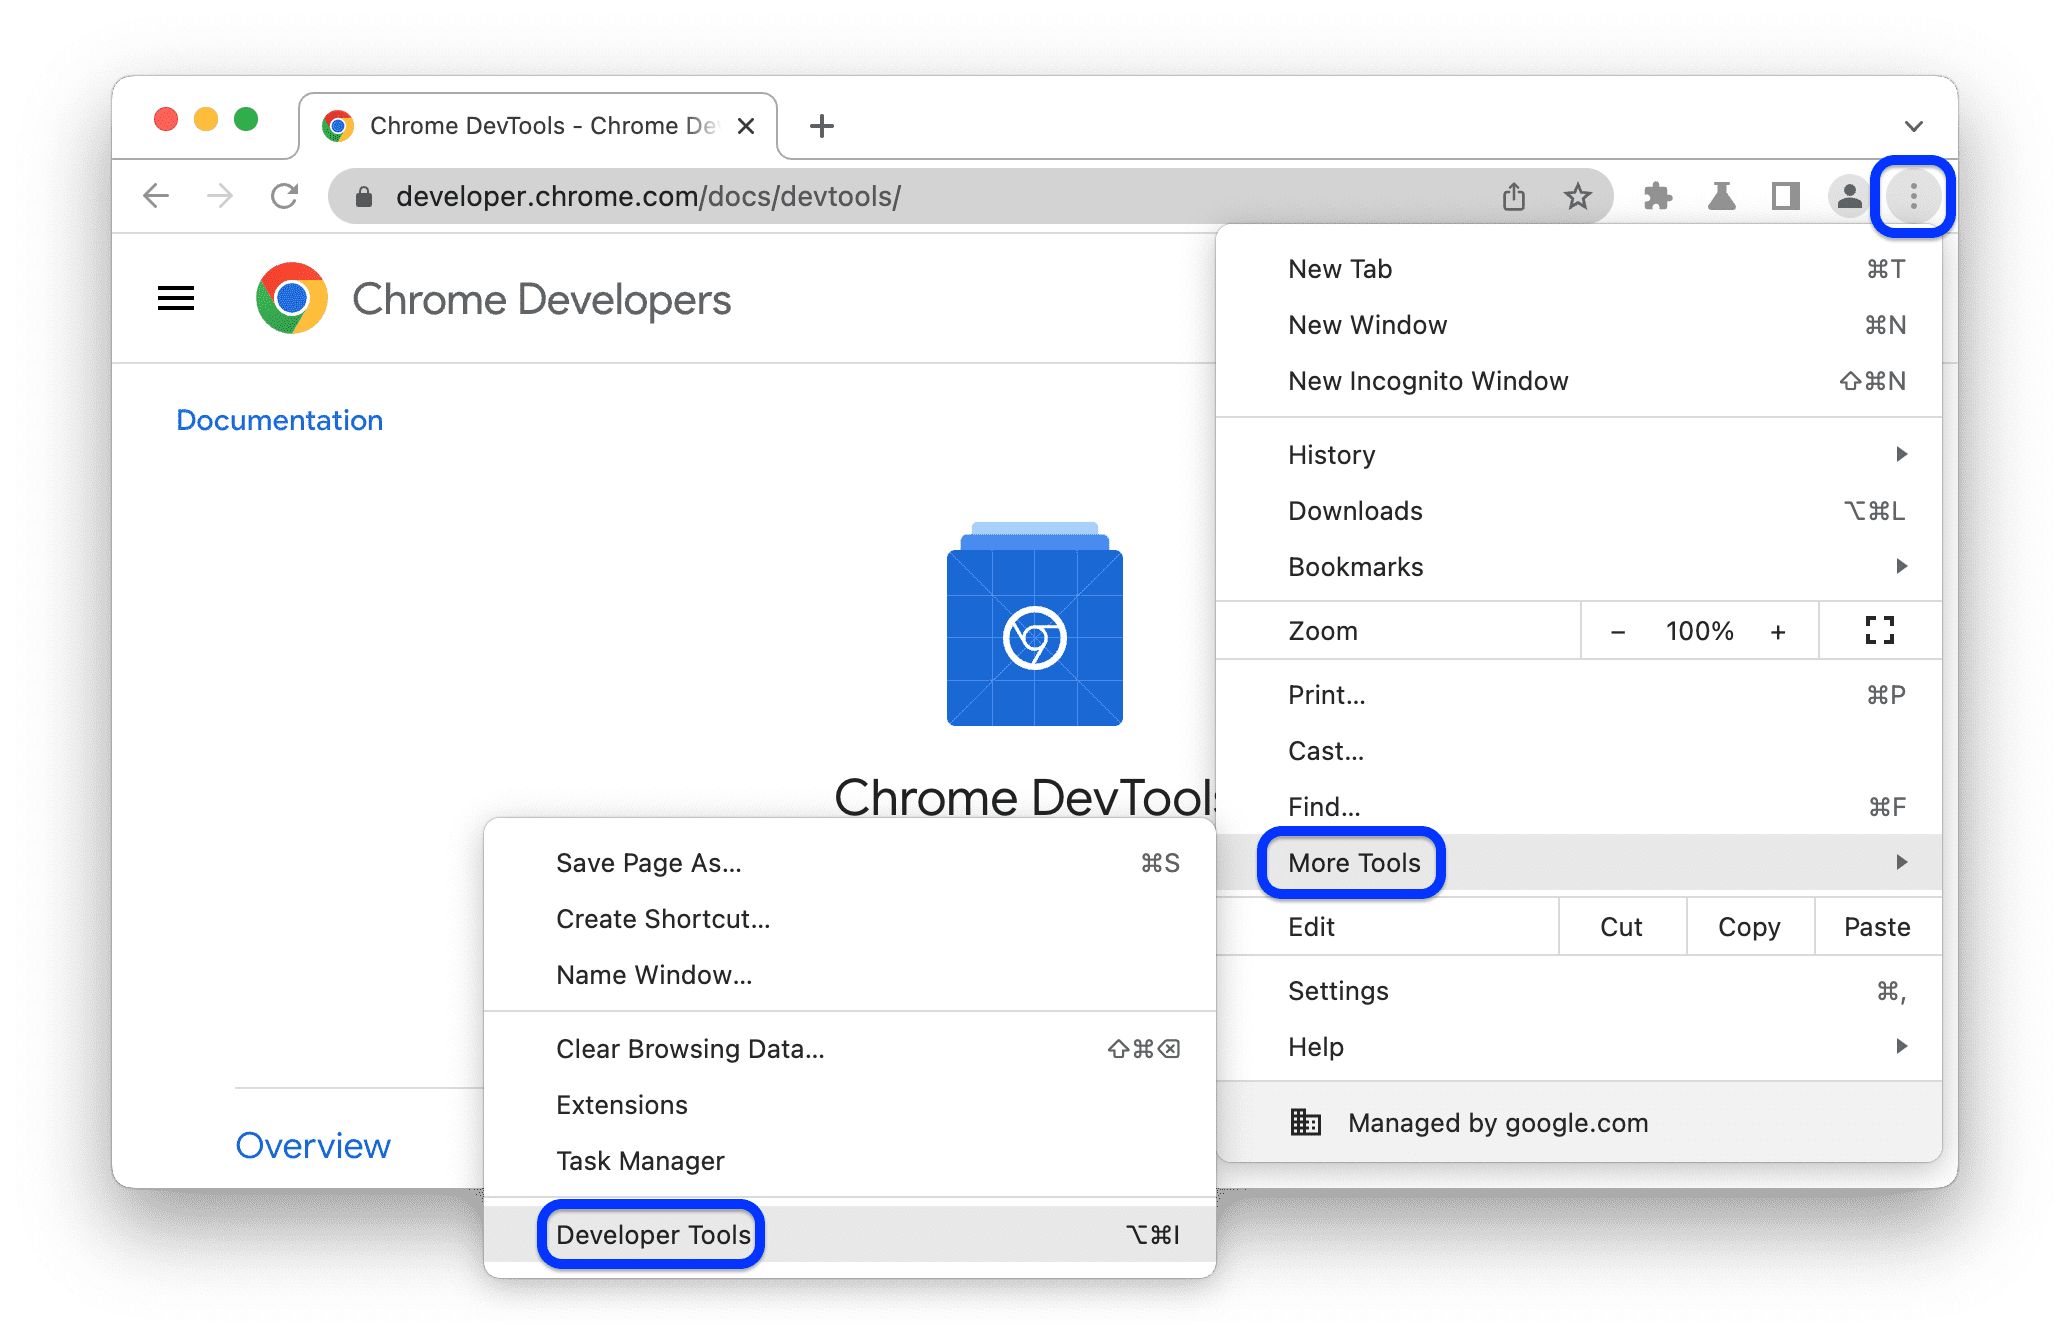
Opening Chrome Developer Tools is a straightforward process that provides instant access to a wide array of powerful web development and debugging features. Whether you're a web developer, designer, or simply curious about the inner workings of a website, Chrome Developer Tools offers a wealth of insights and functionalities.
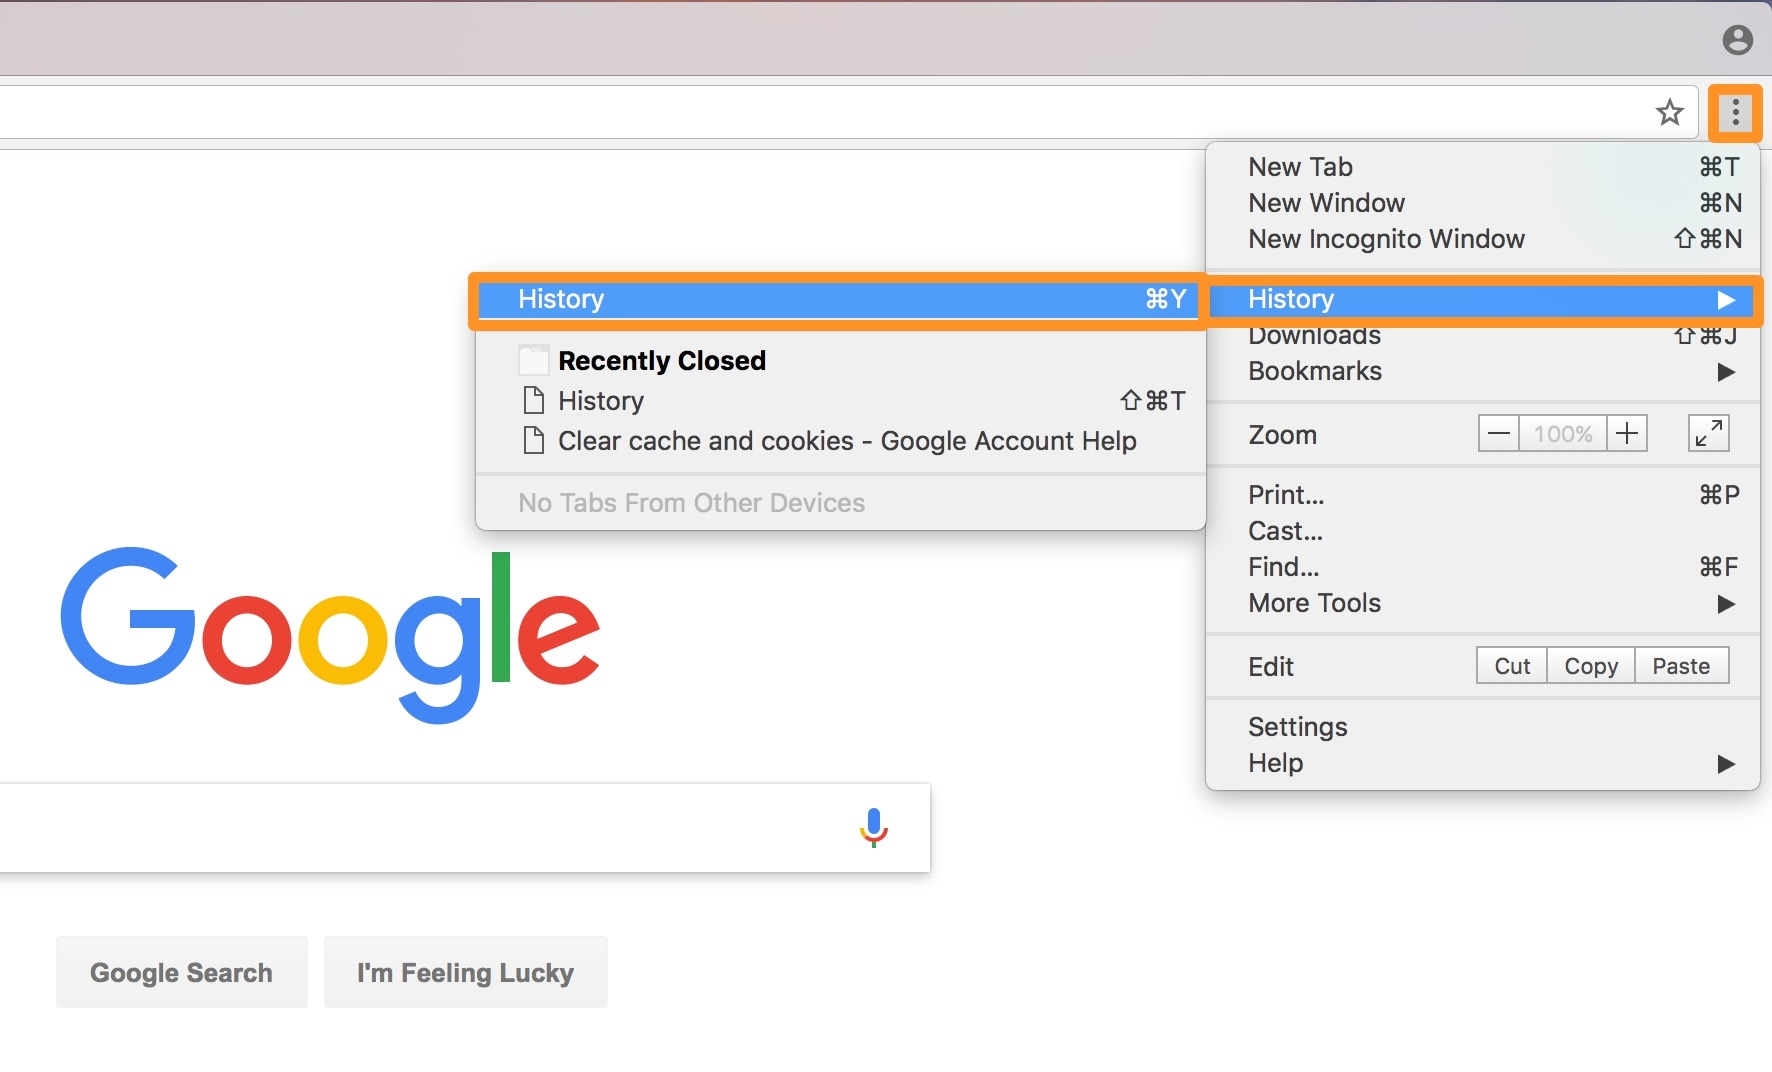
To open Chrome Developer Tools, simply right-click anywhere on a web page and select "Inspect" from the context menu. Alternatively, you can use the keyboard shortcut Ctrl + Shift + I (Windows/Linux) or Cmd + Option + I (Mac). This action will launch the Developer Tools panel, which is typically divided into several distinct panels, each serving a specific purpose.
Upon opening Chrome Developer Tools, you'll be greeted with a wealth of information and tools at your disposal. The interface is designed to be intuitive and user-friendly, allowing you to seamlessly navigate between different panels and access the features you need.
The primary panels within Chrome Developer Tools include Elements, Console, Sources, Network, Performance, Memory, Application, Security, and Audits. Each panel is tailored to address different aspects of web development and debugging, providing valuable insights and functionalities to aid in the optimization and troubleshooting of web applications.
By familiarizing yourself with the process of opening Chrome Developer Tools and understanding the layout of the various panels, you can effectively leverage these tools to inspect and modify the structure of web pages, debug JavaScript code, analyze network activity, optimize performance, manage application resources, and ensure the security of web applications.
In the subsequent sections of this guide, we will delve into each of these panels in detail, exploring their respective features and functionalities to provide you with a comprehensive understanding of how to harness the full potential of Chrome Developer Tools.
Opening Chrome Developer Tools is the gateway to a wealth of invaluable resources for web development and debugging, empowering you to gain deep insights into the inner workings of web applications and enhance your proficiency as a developer. Whether you're a seasoned professional or just starting out, Chrome Developer Tools is an indispensable companion in your journey to create exceptional web experiences.
Elements Panel
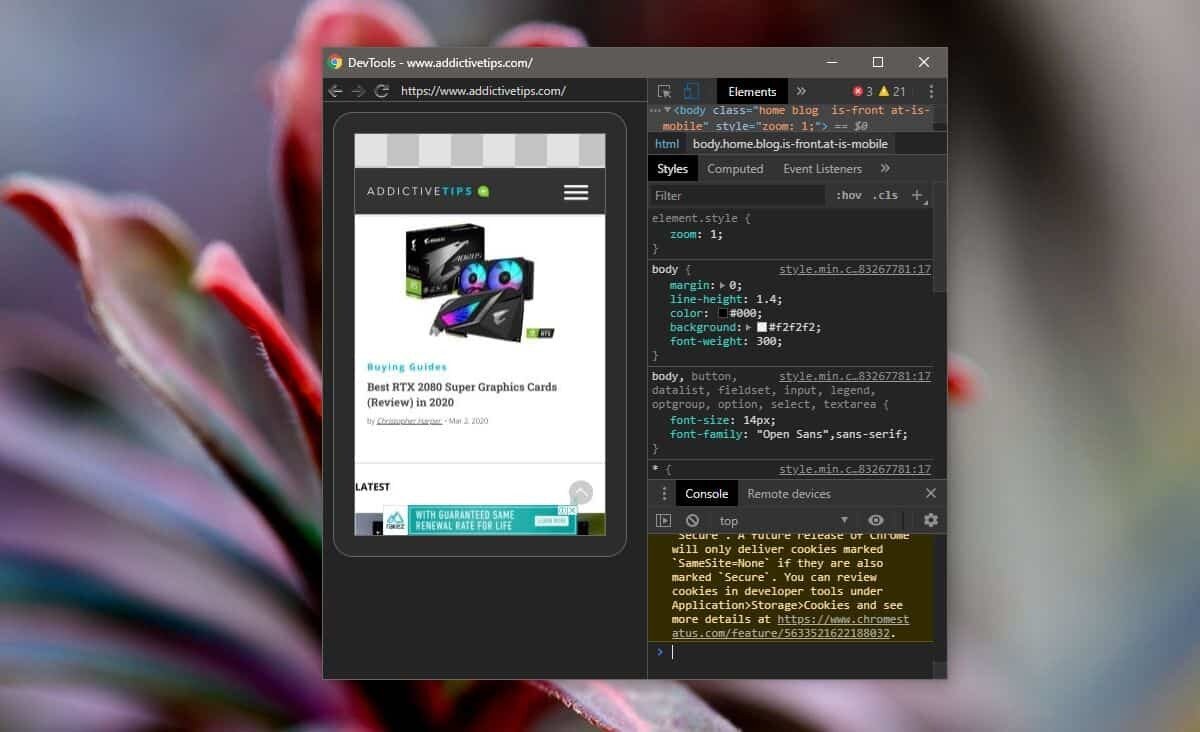
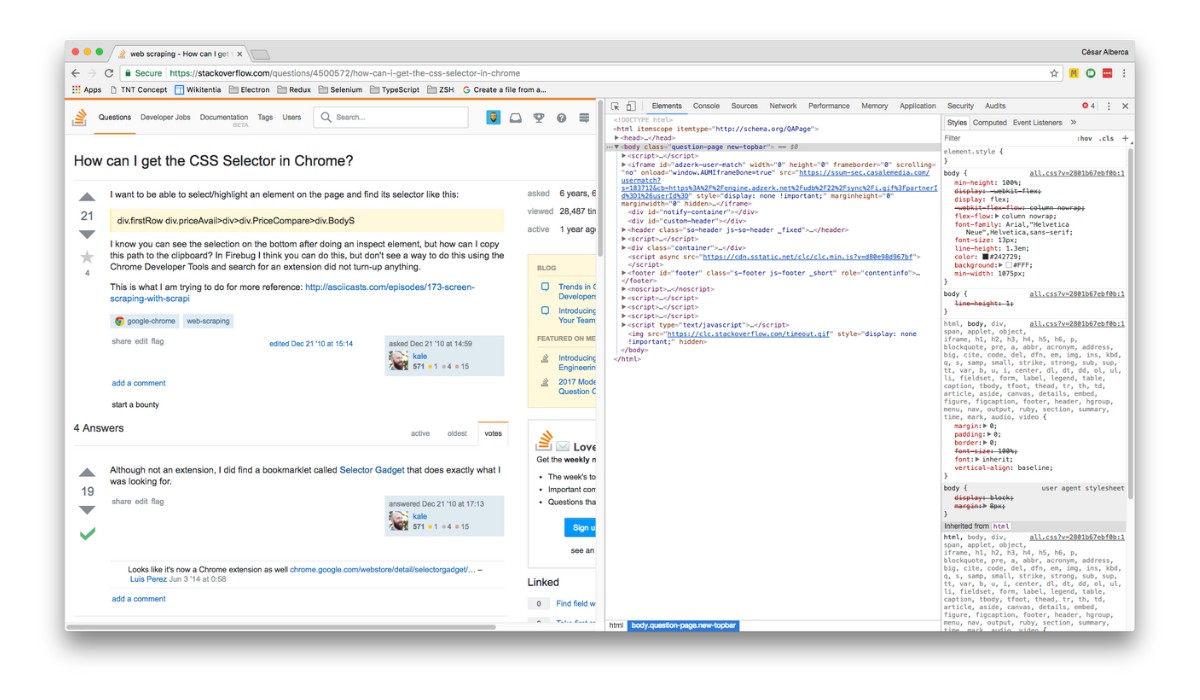
The Elements panel within Chrome Developer Tools serves as a fundamental tool for inspecting and manipulating the structure and layout of web pages. Upon opening the Elements panel, you are presented with a visual representation of the Document Object Model (DOM) of the current web page. The DOM is a hierarchical representation of the HTML elements on the page, and the Elements panel provides a powerful interface for interacting with and modifying these elements.
One of the key features of the Elements panel is the ability to inspect and modify the properties of HTML elements in real time. By simply hovering over an element within the panel, the corresponding element on the web page is highlighted, providing a visual indication of its position and dimensions. This feature is particularly useful for identifying specific elements on a page and understanding their styling and layout properties.
Furthermore, the Elements panel allows you to inspect and edit the HTML and CSS properties of elements directly within the browser. By selecting an element, you can view and modify its attributes, styles, classes, and event listeners, providing a seamless way to experiment with different design and layout changes without altering the actual source code.
In addition to inspecting and modifying individual elements, the Elements panel offers a range of powerful functionalities for navigating and understanding the structure of the DOM. You can expand and collapse nested elements to visualize the hierarchy of the DOM, making it easier to comprehend the relationships between different elements on the page.
Moreover, the Elements panel provides a comprehensive set of tools for debugging and troubleshooting layout issues. You can leverage the Box Model tool to visualize the dimensions and spacing of elements, helping to identify potential layout inconsistencies and resolve styling conflicts.
Another notable feature of the Elements panel is the ability to add, remove, and modify HTML elements directly within the panel, enabling you to experiment with different content and layout changes in real time. This functionality is invaluable for prototyping and testing design modifications without the need to switch back and forth between the code editor and the browser.
In summary, the Elements panel in Chrome Developer Tools is a versatile and indispensable tool for inspecting, manipulating, and debugging the structure and layout of web pages. Whether you're fine-tuning the visual presentation of a website, troubleshooting layout issues, or experimenting with design changes, the Elements panel provides a rich set of features to streamline your web development workflow and enhance the quality of your web applications.
Console Panel
The Console panel in Chrome Developer Tools is a versatile and powerful tool that serves as a command-line interface for executing JavaScript code, logging information, and debugging web applications. It provides a centralized environment for interacting with the JavaScript runtime of a web page, enabling developers to execute code snippets, log messages, inspect objects, and diagnose runtime errors.
One of the primary functions of the Console panel is to execute JavaScript code directly within the context of the current web page. This feature allows developers to test and experiment with JavaScript functionality without the need to modify the source code. By entering JavaScript expressions and statements into the console, developers can quickly evaluate their behavior and observe the resulting output, making it an invaluable tool for rapid prototyping and debugging.
In addition to executing code, the Console panel serves as a logging interface for capturing and displaying various types of messages, including informational logs, warnings, errors, and custom messages generated by JavaScript code. This logging functionality is instrumental in providing real-time feedback on the behavior of a web application, allowing developers to track the flow of execution, monitor variable values, and identify potential issues or unexpected behaviors.
Furthermore, the Console panel offers a range of powerful debugging features to aid in the identification and resolution of runtime errors and JavaScript-related issues. Developers can leverage the console to log error messages, stack traces, and detailed information about exceptions, providing valuable insights into the root causes of runtime errors and unexpected behaviors within their web applications.
Another notable feature of the Console panel is the ability to interact with and inspect JavaScript objects and variables in real time. Developers can access and manipulate the state of the web page's JavaScript runtime, inspecting the properties and values of objects, evaluating expressions, and even modifying variables on the fly. This level of interactivity and introspection is invaluable for gaining deep insights into the behavior of JavaScript code and diagnosing complex issues within web applications.
In summary, the Console panel in Chrome Developer Tools is an essential component of the web developer's toolkit, offering a comprehensive set of features for executing JavaScript code, logging messages, and debugging web applications. Whether you're testing JavaScript functionality, monitoring runtime behavior, or diagnosing errors, the Console panel provides a rich and interactive environment to enhance your proficiency as a web developer.
Sources Panel
The Sources panel in Chrome Developer Tools is a multifaceted tool that empowers developers to inspect, debug, and analyze the JavaScript source code of web applications. Upon opening the Sources panel, you are presented with a comprehensive interface for navigating and interacting with the JavaScript source files that comprise the web page, providing invaluable insights into the behavior and execution of client-side code.
One of the primary functions of the Sources panel is to facilitate the inspection and debugging of JavaScript source code. Developers can explore the structure of the source files, navigate through different directories, and examine the contents of individual scripts. This functionality is particularly useful for gaining a deeper understanding of the organization and architecture of the JavaScript codebase, enabling developers to identify specific functions, classes, and modules within the application.
Furthermore, the Sources panel offers a rich set of debugging features to aid in the identification and resolution of JavaScript-related issues. Developers can set breakpoints within the source code, allowing them to pause the execution of the application at specific points and inspect the state of variables, objects, and functions. This level of introspection is invaluable for diagnosing complex runtime behaviors, tracking the flow of execution, and identifying the root causes of errors and unexpected behaviors within the JavaScript code.
In addition to debugging, the Sources panel provides a range of powerful tools for managing and editing JavaScript source files directly within the browser. Developers can modify the contents of source files, add new scripts, and even experiment with live code changes, providing a seamless environment for prototyping and testing JavaScript functionality without the need to switch back and forth between the code editor and the browser.
Moreover, the Sources panel integrates with source map support, allowing developers to map minified or transpiled code back to its original source, making it easier to debug and trace issues in production environments. This feature is particularly valuable for working with complex build processes and optimizing the performance of web applications.
In summary, the Sources panel in Chrome Developer Tools is an indispensable resource for inspecting, debugging, and managing the JavaScript source code of web applications. Whether you're troubleshooting runtime issues, exploring the structure of a codebase, or experimenting with live code changes, the Sources panel offers a rich and interactive environment to enhance your proficiency as a web developer.
Network Panel
The Network panel in Chrome Developer Tools is a vital resource for analyzing and optimizing the network performance of web applications. Upon opening the Network panel, developers are presented with a comprehensive overview of network activity, including the loading and transmission of resources such as HTML, CSS, JavaScript, images, fonts, and XHR (XMLHttpRequest) requests.
One of the primary functions of the Network panel is to provide detailed insights into the network requests made by the web page, allowing developers to monitor the timing, size, and status of each request. This information is instrumental in identifying potential bottlenecks, latency issues, and inefficient resource loading, enabling developers to optimize the network performance of their web applications.
Furthermore, the Network panel offers a range of powerful tools for analyzing the loading and transmission of resources. Developers can inspect the headers, payloads, and response data of individual network requests, gaining a deeper understanding of the communication between the client and the server. This level of visibility is invaluable for diagnosing issues related to caching, compression, and server responses, ultimately leading to improved network efficiency and faster page load times.
In addition to monitoring network requests, the Network panel provides comprehensive performance metrics to aid in the evaluation and optimization of web application loading times. Developers can leverage the panel to analyze the timing and sequence of resource loading, identify potential opportunities for parallelization and optimization, and gain insights into the overall network performance of the web page.
Moreover, the Network panel integrates with various filtering and sorting options, allowing developers to focus on specific types of network requests, status codes, or resource types. This level of customization enables developers to isolate and analyze specific aspects of network activity, making it easier to identify and address performance bottlenecks and inefficiencies.
In summary, the Network panel in Chrome Developer Tools is an indispensable tool for analyzing and optimizing the network performance of web applications. Whether you're striving to enhance page load times, diagnose network-related issues, or optimize resource loading, the Network panel offers a rich and interactive environment to elevate your proficiency as a web developer.
Performance Panel
The Performance panel in Chrome Developer Tools is a powerful and comprehensive tool designed to aid developers in analyzing and optimizing the performance of web applications. Upon opening the Performance panel, developers are presented with a rich set of features and functionalities to gain deep insights into the runtime behavior, loading times, and execution characteristics of web pages.
One of the primary functions of the Performance panel is to facilitate the recording and analysis of performance profiles for web applications. Developers can initiate a performance recording, which captures a detailed timeline of events such as loading, scripting, rendering, and user interactions. This timeline provides a visual representation of the various activities and processes occurring within the web page, enabling developers to identify performance bottlenecks, latency issues, and opportunities for optimization.
Furthermore, the Performance panel offers a range of powerful tools for analyzing the performance timeline, allowing developers to delve into specific segments of the recording and gain detailed insights into the timing and execution of individual tasks. This level of granularity is instrumental in diagnosing issues related to scripting, rendering, layout, and resource loading, ultimately leading to improved responsiveness and user experience.
In addition to performance recording and analysis, the Performance panel provides comprehensive performance metrics to aid in the evaluation and optimization of web application loading and execution times. Developers can leverage the panel to analyze key performance indicators such as CPU utilization, network activity, and memory usage, gaining valuable insights into the resource consumption and efficiency of the web page.
Moreover, the Performance panel integrates with various visualization and filtering options, allowing developers to focus on specific aspects of the performance timeline, such as scripting activity, rendering performance, or user interactions. This level of customization enables developers to isolate and analyze specific areas of performance, making it easier to identify and address bottlenecks and inefficiencies.
In summary, the Performance panel in Chrome Developer Tools is an indispensable resource for analyzing and optimizing the performance of web applications. Whether you're striving to enhance loading times, diagnose performance-related issues, or optimize resource utilization, the Performance panel offers a rich and interactive environment to elevate your proficiency as a web developer.
Memory Panel
The Memory panel in Chrome Developer Tools is a critical component for analyzing and optimizing the memory usage of web applications. Upon accessing the Memory panel, developers are equipped with a comprehensive set of tools and functionalities to gain deep insights into memory allocation, consumption, and potential memory leaks within their web pages.
One of the primary functions of the Memory panel is to provide real-time visibility into the memory usage of the web application. Developers can monitor the allocation and deallocation of memory, track memory consumption over time, and identify potential memory-intensive operations. This level of visibility is instrumental in diagnosing memory-related issues and optimizing the overall memory footprint of the web application.
Furthermore, the Memory panel offers a range of powerful tools for analyzing memory usage and identifying potential memory leaks. Developers can initiate memory snapshots, which capture a detailed snapshot of the memory heap at a specific point in time. These snapshots provide insights into memory allocation patterns, object retention, and potential memory leaks, enabling developers to pinpoint areas of inefficiency and optimize memory usage.
In addition to memory profiling, the Memory panel provides comprehensive memory metrics to aid in the evaluation and optimization of memory utilization. Developers can leverage the panel to analyze key memory indicators such as heap size, object allocations, and garbage collection activity, gaining valuable insights into the memory consumption and efficiency of the web page.
Moreover, the Memory panel integrates with various visualization and filtering options, allowing developers to focus on specific aspects of memory usage, such as object allocations, retained memory, or memory snapshots. This level of customization enables developers to isolate and analyze specific areas of memory usage, making it easier to identify and address memory-related issues.
In summary, the Memory panel in Chrome Developer Tools is an indispensable resource for analyzing and optimizing the memory usage of web applications. Whether you're striving to diagnose memory leaks, optimize memory consumption, or enhance the overall performance of the web page, the Memory panel offers a rich and interactive environment to elevate your proficiency as a web developer.
Application Panel
The Application panel in Chrome Developer Tools serves as a comprehensive hub for managing various aspects of web application development, including local storage, session storage, cookies, cache storage, and service workers. Upon accessing the Application panel, developers are presented with a wealth of tools and functionalities to inspect, modify, and analyze the application's storage and caching mechanisms, as well as to manage service workers for progressive web applications.
One of the primary functions of the Application panel is to provide insights into the storage mechanisms utilized by the web application. Developers can explore the contents of local storage and session storage, inspect the data stored in cookies, and analyze the resources stored in the cache storage. This level of visibility is instrumental in understanding how the application manages and persists data locally, enabling developers to diagnose storage-related issues and optimize data management strategies.
Furthermore, the Application panel offers a range of powerful tools for managing and manipulating the storage and caching mechanisms of the web application. Developers can add, remove, and modify key-value pairs in local storage and session storage, providing a seamless way to experiment with different data scenarios and test the application's behavior under various storage conditions. Additionally, developers can inspect and manage the cookies associated with the application, enabling them to control the storage and expiration of cookie data.
In addition to storage management, the Application panel provides comprehensive insights into the usage and performance of service workers. Developers can register and inspect service workers, view the associated worker scripts, and analyze the lifecycle and events related to service worker activation and control. This functionality is particularly valuable for progressive web applications, enabling developers to optimize the caching and offline capabilities of their applications through service worker management.
Moreover, the Application panel integrates with various debugging and testing features, allowing developers to simulate offline scenarios, test service worker behaviors, and analyze the impact of storage and caching mechanisms on the application's performance. This level of interactivity and introspection is invaluable for diagnosing issues related to data persistence, caching strategies, and service worker functionality, ultimately leading to improved reliability and user experience.
In summary, the Application panel in Chrome Developer Tools is an indispensable resource for managing and optimizing the storage, caching, and service worker capabilities of web applications. Whether you're striving to enhance data management, diagnose storage-related issues, or optimize the offline capabilities of the application, the Application panel offers a rich and interactive environment to elevate your proficiency as a web developer.
Security Panel
The Security panel in Chrome Developer Tools is a crucial component for assessing and enhancing the security posture of web applications. When developers access the Security panel, they gain access to a comprehensive suite of tools and features designed to identify potential security vulnerabilities, enforce secure communication practices, and ensure the integrity and confidentiality of user data.
One of the primary functions of the Security panel is to provide real-time insights into the security status of the web application. Developers can leverage the panel to analyze the security indicators such as the presence of secure connections (HTTPS), the validity of SSL/TLS certificates, and the absence of mixed content. This visibility is instrumental in identifying potential security risks and ensuring that the application adheres to best practices for secure communication.
Furthermore, the Security panel offers a range of powerful tools for diagnosing and addressing security-related issues. Developers can inspect the details of SSL/TLS certificates, including their validity, issuer information, and encryption algorithms. This feature enables developers to verify the authenticity and trustworthiness of the certificates used by the application, ensuring that sensitive data is transmitted securely and protected from potential eavesdropping or tampering.
In addition to certificate inspection, the Security panel provides insights into the presence of mixed content, which refers to the inclusion of non-secure (HTTP) resources within a secure (HTTPS) context. Developers can identify and address instances of mixed content, ensuring that all resources loaded by the application are transmitted securely, thereby mitigating the risk of data interception and manipulation.
Moreover, the Security panel integrates with various security debugging features, allowing developers to simulate security scenarios, test the behavior of secure connections, and analyze the impact of security configurations on the application's security posture. This level of interactivity and introspection is invaluable for diagnosing security vulnerabilities, enforcing secure communication practices, and safeguarding the application against potential threats.
In summary, the Security panel in Chrome Developer Tools is an indispensable resource for evaluating and enhancing the security of web applications. Whether developers are striving to enforce secure communication, diagnose security-related issues, or optimize the application's security posture, the Security panel offers a rich and interactive environment to elevate their proficiency in securing web applications.
Audits Panel
The Audits panel in Chrome Developer Tools is a comprehensive tool designed to analyze and optimize the performance, accessibility, best practices, SEO, and progressive web app (PWA) aspects of web applications. When developers access the Audits panel, they gain access to a suite of powerful auditing and reporting features that provide valuable insights into the overall health and quality of their web applications.
One of the primary functions of the Audits panel is to conduct comprehensive audits of web applications, evaluating various aspects such as performance, accessibility, best practices, SEO, and PWA compliance. Developers can initiate audits tailored to specific categories or run a comprehensive audit covering all aspects, allowing them to gain deep insights into potential issues and opportunities for improvement.
Furthermore, the Audits panel offers a range of powerful tools for generating detailed reports based on the audit results. Developers can review comprehensive reports that highlight areas of concern, provide actionable recommendations, and offer insights into the overall performance, accessibility, and compliance of the web application. These reports serve as invaluable resources for identifying and addressing potential issues that may impact the user experience and the application's visibility in search engines.
In addition to auditing and reporting, the Audits panel provides actionable recommendations and best practices to aid developers in optimizing the performance, accessibility, and SEO aspects of their web applications. By following the recommendations provided in the audit reports, developers can implement improvements that enhance the speed, usability, and search engine visibility of their applications, ultimately leading to a better user experience and improved discoverability.
Moreover, the Audits panel integrates with various customization options, allowing developers to tailor the audits to specific requirements and preferences. Whether developers are focused on improving performance, ensuring accessibility, adhering to best practices, optimizing SEO, or enhancing PWA capabilities, the Audits panel offers a rich and interactive environment to elevate the overall quality and user experience of web applications.
In summary, the Audits panel in Chrome Developer Tools is an indispensable resource for evaluating and optimizing the performance, accessibility, best practices, SEO, and PWA aspects of web applications. Whether developers are striving to enhance the user experience, ensure compliance with industry standards, or improve the visibility of their applications, the Audits panel offers a comprehensive suite of features to elevate the overall quality and effectiveness of web applications.
Conclusion
In conclusion, Chrome Developer Tools stands as an indispensable companion for web developers, offering a rich array of features and functionalities to streamline the development process, diagnose issues, and optimize the performance and security of web applications. By delving into the various panels within Chrome Developer Tools, developers can gain deep insights into the inner workings of their web applications, empowering them to create exceptional user experiences and ensure the reliability and security of their applications.
From the Elements panel, which provides a comprehensive interface for inspecting and manipulating the structure and layout of web pages, to the Console panel, which serves as a command-line interface for executing JavaScript code and debugging web applications, Chrome Developer Tools offers a versatile toolkit for web development and troubleshooting. The Sources panel facilitates the inspection and debugging of JavaScript source code, while the Network panel empowers developers to analyze and optimize the network performance of web applications. The Performance panel provides a detailed timeline of events, enabling developers to identify performance bottlenecks and optimize the loading and execution times of web pages. Additionally, the Memory panel offers insights into memory allocation, consumption, and potential memory leaks, while the Application panel provides tools for managing storage, caching, and service workers. The Security panel ensures the integrity and confidentiality of user data, while the Audits panel offers comprehensive auditing and reporting features to evaluate and optimize the performance, accessibility, best practices, SEO, and PWA aspects of web applications.
By mastering Chrome Developer Tools, developers can elevate their proficiency in web development, enhance the quality and performance of their applications, and ensure a secure and seamless user experience. Whether it's troubleshooting layout issues, optimizing network performance, diagnosing memory leaks, or ensuring compliance with industry standards, Chrome Developer Tools provides a comprehensive suite of features to address the diverse needs of web developers.
In essence, Chrome Developer Tools serves as a catalyst for innovation and excellence in web development, empowering developers to create web applications that are not only visually appealing and performant but also secure and accessible. As the web development landscape continues to evolve, Chrome Developer Tools remains an essential resource for developers seeking to stay ahead of the curve and deliver exceptional web experiences.