Introduction
When it comes to web development, understanding and debugging JavaScript code is crucial for creating dynamic and interactive web experiences. JavaScript is the backbone of modern web applications, powering everything from simple animations to complex functionality. As a developer, being able to view and analyze JavaScript code is essential for troubleshooting and enhancing the performance of your web projects.
One of the most popular web browsers, Google Chrome, provides a powerful set of developer tools that enable you to inspect, debug, and modify the code of a web page. These tools offer a comprehensive suite of features, including the ability to view and interact with JavaScript code in real-time. By leveraging Chrome's developer tools, you can gain valuable insights into how JavaScript is executed, identify potential issues, and optimize the performance of your web applications.
In this article, we will explore how to use Chrome's developer tools to view JavaScript code. Whether you're a seasoned developer or just starting out, understanding how to access and analyze JavaScript code in Chrome can significantly improve your web development workflow. So, let's dive into the world of Chrome developer tools and uncover the techniques for inspecting and debugging JavaScript code with ease.
Opening Chrome Developer Tools
To begin our journey into the realm of JavaScript code inspection, we first need to open Chrome Developer Tools. This powerful set of utilities is built directly into the Chrome browser, providing developers with a wide array of features for debugging and optimizing web applications.
There are several ways to access Chrome Developer Tools. One of the most common methods is to right-click on any element within a web page and select "Inspect" from the context menu. This action will open the developer tools panel, allowing you to explore the HTML, CSS, and JavaScript code associated with the selected element.
Another way to open Chrome Developer Tools is by using keyboard shortcuts. Simply press "Ctrl + Shift + I" (Windows/Linux) or "Cmd + Option + I" (Mac) to instantly launch the developer tools panel. This quick and convenient shortcut is a favorite among developers for its efficiency in accessing the powerful debugging capabilities of Chrome.
For those who prefer a more visual approach, Chrome also offers a menu-based method for opening developer tools. By clicking on the three-dot menu icon in the top-right corner of the browser window, navigating to "More tools," and selecting "Developer tools," you can open the developer tools panel with just a few clicks.
Regardless of the method you choose, once Chrome Developer Tools is open, you'll be greeted with a comprehensive set of tabs and tools designed to assist you in inspecting and debugging web content. From the Elements tab for examining the HTML structure to the Network tab for monitoring network activity, Chrome Developer Tools provides a wealth of resources for developers.
Now that we've successfully opened Chrome Developer Tools, we're ready to delve into the next step of our journey: navigating to the Sources tab, where we can explore and interact with JavaScript code in greater detail.
Navigating to the Sources Tab
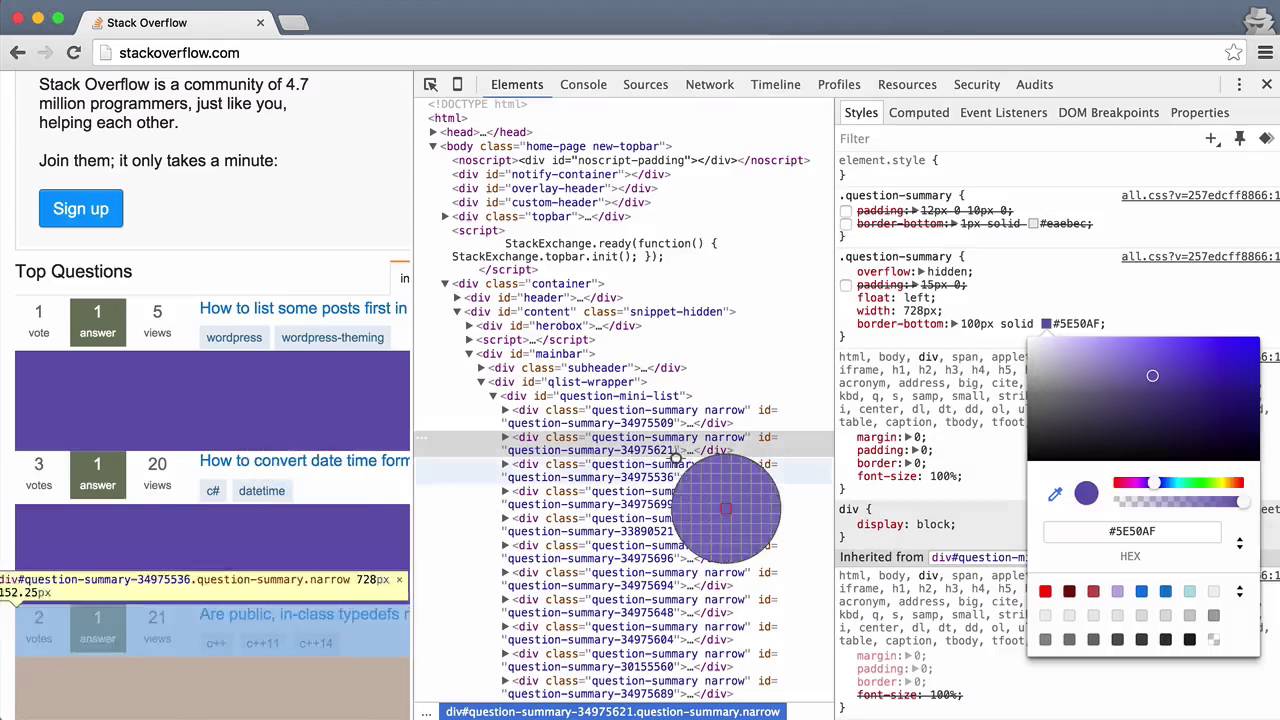
Once Chrome Developer Tools is open, the next step in our quest to explore JavaScript code is to navigate to the Sources tab. This tab serves as the gateway to inspecting and interacting with the JavaScript code that powers the web page. By accessing the Sources tab, developers can gain valuable insights into how JavaScript is executed, set breakpoints for debugging, and even make live edits to the code.
Upon clicking on the Sources tab within Chrome Developer Tools, you'll be presented with a multifaceted interface that empowers you to explore the JavaScript code associated with the current web page. The left-hand panel displays a hierarchical view of the page's resources, including JavaScript files, which can be expanded to reveal their contents. This intuitive layout allows you to quickly locate and navigate through the JavaScript files that contribute to the functionality of the web page.
In addition to providing a structured view of the page's resources, the Sources tab offers a powerful set of tools for inspecting and debugging JavaScript code. The main panel displays the contents of the selected JavaScript file, complete with syntax highlighting and line numbers for easy navigation. This enables you to examine the code in detail, identify potential issues, and gain a deeper understanding of how the JavaScript functions within the web page.
One of the most valuable features of the Sources tab is the ability to set breakpoints within the JavaScript code. By clicking on the line number of a specific code segment, you can create a breakpoint, which will pause the execution of the code when reached. This functionality is instrumental for debugging, as it allows you to inspect the state of variables, track the flow of the code, and diagnose any unexpected behavior.
Furthermore, the Sources tab enables developers to make live edits to the JavaScript code, providing a seamless way to experiment with changes and observe their immediate effects. Whether it's tweaking a function, modifying a variable, or testing a new algorithm, the ability to edit JavaScript code in real-time empowers developers to iterate and refine their code with unparalleled efficiency.
In essence, navigating to the Sources tab within Chrome Developer Tools opens up a world of possibilities for inspecting and interacting with JavaScript code. From gaining a comprehensive view of the code structure to setting breakpoints for debugging and making live edits, the Sources tab equips developers with the tools they need to unravel the intricacies of JavaScript and elevate their web development endeavors.
Viewing and Debugging JavaScript Code
When it comes to web development, the ability to view and debug JavaScript code is indispensable. Chrome Developer Tools provides a robust set of features that empower developers to inspect, analyze, and debug JavaScript code with precision and efficiency.
Inspecting JavaScript Code
Upon navigating to the Sources tab within Chrome Developer Tools, developers are presented with a comprehensive view of the JavaScript files associated with the web page. The hierarchical layout of the left-hand panel allows for easy navigation through the page's resources, enabling developers to locate and select the specific JavaScript file they wish to inspect.
The main panel of the Sources tab displays the contents of the selected JavaScript file, complete with syntax highlighting and line numbers. This intuitive interface provides developers with a clear and structured view of the JavaScript code, facilitating in-depth inspection and analysis. By examining the code in detail, developers can gain valuable insights into its structure, logic, and functionality, laying the groundwork for effective debugging and optimization.
Setting Breakpoints
One of the most powerful capabilities offered by Chrome Developer Tools is the ability to set breakpoints within JavaScript code. By clicking on the line number of a particular code segment, developers can create breakpoints that pause the execution of the code when reached. This functionality is instrumental for debugging, as it allows developers to inspect the state of variables, track the flow of the code, and identify potential issues.
Setting breakpoints provides a dynamic way to interact with JavaScript code, enabling developers to observe its behavior and pinpoint areas that require attention. Whether it's isolating a specific function, monitoring the values of variables, or tracing the sequence of code execution, breakpoints serve as invaluable tools for gaining a deeper understanding of JavaScript code and diagnosing potential issues.
Making Live Edits
In addition to inspecting and setting breakpoints within JavaScript code, Chrome Developer Tools empowers developers to make live edits to the code, offering a seamless way to experiment with changes and observe their immediate effects. This feature enables developers to iteratively refine and optimize their JavaScript code, fostering a dynamic and responsive development workflow.
Whether it involves tweaking a function to enhance its performance, modifying the value of a variable to test different scenarios, or experimenting with new logic, the ability to make live edits provides developers with a powerful mechanism for rapidly iterating on their JavaScript code. This iterative approach not only streamlines the debugging process but also fosters a creative and exploratory mindset, ultimately leading to more robust and efficient code.
In essence, Chrome Developer Tools equips developers with a rich set of capabilities for viewing and debugging JavaScript code. From inspecting the structure and logic of the code to setting breakpoints for in-depth debugging and making live edits for iterative refinement, the tools provided by Chrome Developer Tools empower developers to unravel the intricacies of JavaScript and elevate the quality of their web applications.