Introduction
Running a JavaScript (JS) file in the Chrome browser can be a powerful way to test and debug code, experiment with new features, or enhance the functionality of web pages. By executing a JS file directly within the browser, developers can gain valuable insights into how their code behaves in a real-world environment. Whether you're a seasoned developer or just starting out, understanding how to run a JS file in Chrome can significantly streamline your workflow and improve your coding efficiency.
In this comprehensive guide, we will walk through the step-by-step process of running a JS file in the Chrome browser. By following these instructions, you'll be able to seamlessly integrate your JS code into the browser environment, allowing for real-time testing and debugging. From opening the Chrome browser to executing the JS file, each step is designed to provide clear and actionable guidance, ensuring that you can harness the full potential of Chrome's development tools.
So, without further ado, let's dive into the fascinating world of running JS files in Chrome and unlock the endless possibilities that come with seamless integration of JavaScript code into the browser environment. Whether you're a web developer, a coding enthusiast, or simply curious about the inner workings of web technologies, this guide is your gateway to mastering the art of running JS files in Chrome.
Step 1: Open Chrome Browser
To begin the process of running a JavaScript (JS) file in the Chrome browser, the first step is to open the Chrome browser on your computer. Chrome is a widely used web browser known for its speed, simplicity, and powerful developer tools, making it an ideal platform for testing and debugging JS code.
You can launch the Chrome browser by clicking on its icon in the taskbar, desktop, or applications folder, depending on your operating system. Upon opening Chrome, you will be greeted by the familiar interface, featuring the address bar, tabs, and various navigation controls.
Once the browser is up and running, you are ready to proceed to the next steps in the process of running a JS file in Chrome. With Chrome's intuitive interface and robust feature set, you are well-equipped to leverage its capabilities for seamless JS file execution and development.
Opening the Chrome browser is the foundational step that sets the stage for the subsequent actions, allowing you to harness the full potential of Chrome's developer tools and resources. Whether you are a seasoned developer or a newcomer to the world of web development, Chrome provides a user-friendly environment for working with JS files and exploring the intricacies of JavaScript code.
With Chrome at your fingertips, you are poised to embark on an exciting journey through the realms of web development, where JS files come to life within the browser environment. As we move forward to the next steps, the foundation laid by opening the Chrome browser will prove instrumental in enabling a seamless and efficient workflow for running JS files and honing your development skills.
Now that Chrome is open and ready for action, let's delve deeper into the subsequent steps that will guide you through the process of running a JS file in the Chrome browser, unlocking a world of possibilities for testing, debugging, and refining your JavaScript code.
Step 2: Open Developer Tools
Opening the Developer Tools in the Chrome browser is a pivotal step in the process of running a JavaScript (JS) file. Developer Tools, often referred to as DevTools, is a set of web authoring and debugging tools built directly into the Chrome browser. It empowers developers to inspect and modify the structure and behavior of web pages, analyze network activity, debug JavaScript code, and much more. By accessing the Developer Tools, you gain a comprehensive suite of features that streamline the development and debugging of JS files, providing invaluable insights into the inner workings of web applications.
To open Developer Tools in Chrome, you can utilize several methods, each offering quick and convenient access to this essential set of web development tools. One common approach is to right-click on any element within a web page and select "Inspect" from the context menu. This action opens the Developer Tools panel, revealing a wealth of information about the selected element, including its HTML structure, CSS styles, and associated JavaScript code.
Alternatively, you can access Developer Tools by using keyboard shortcuts. Pressing "Ctrl + Shift + I" on Windows or "Cmd + Option + I" on macOS opens the Developer Tools panel, instantly providing access to a wide array of web development and debugging features. This efficient shortcut allows for seamless navigation between the browser window and the Developer Tools, enabling swift interaction with JS files and web page elements.
Another method to open Developer Tools is through the Chrome menu. By clicking on the three-dot menu icon in the top-right corner of the browser window and selecting "More tools" followed by "Developer tools," you can access the full suite of DevTools features. This intuitive approach ensures that Developer Tools are readily available for inspecting and debugging JS files, making it an indispensable resource for web developers and enthusiasts alike.
Upon opening Developer Tools, you are greeted with a multifaceted interface comprising various tabs, including Elements, Console, Sources, Network, and more. Each tab offers distinct functionalities tailored to different aspects of web development, with the "Sources" tab being particularly relevant to running JS files in Chrome. This tab provides a comprehensive view of the JavaScript and other resources associated with the web page, allowing for seamless navigation through JS files and effortless execution of code.
As you embark on the journey of running a JS file in Chrome, the Developer Tools interface becomes your gateway to exploring, testing, and refining JavaScript code. Its seamless integration with the browser environment empowers you to interact with JS files in real time, enabling efficient debugging, code analysis, and experimentation. By opening Developer Tools, you unlock a world of possibilities for harnessing the full potential of JavaScript within the Chrome browser, setting the stage for the subsequent steps in the process of running a JS file.
With Developer Tools at your disposal, you are poised to delve deeper into the intricacies of JS files, leveraging the browser's native capabilities to refine your code, identify potential issues, and enhance the functionality of web applications. As we transition to the next steps, the foundation laid by opening Developer Tools will prove instrumental in facilitating a seamless and productive workflow for running JS files in Chrome, empowering you to unleash the true power of JavaScript within the browser environment.
Step 3: Navigate to Sources Tab
Upon opening the Developer Tools in the Chrome browser, the next crucial step in the process of running a JavaScript (JS) file is to navigate to the "Sources" tab. This tab serves as a central hub for managing and interacting with various resources associated with the web page, including JS files, CSS stylesheets, and other assets. By accessing the Sources tab, you gain a comprehensive view of the JavaScript code powering the web page, allowing for seamless navigation through different JS files and effortless execution of code.
To navigate to the Sources tab, you can simply click on the "Sources" option located within the Developer Tools interface. This action instantly switches the view to the Sources tab, presenting a hierarchical view of the page's resources, including folders, scripts, and any dynamically loaded JS files. The intuitive layout of the Sources tab provides a clear overview of the web page's structure and associated resources, enabling you to locate and interact with JS files with ease.
Once within the Sources tab, you are presented with a multifaceted interface that empowers you to explore and interact with the JavaScript code powering the web page. The left-hand panel displays a tree-like structure representing the various resources, allowing for seamless navigation through different folders and scripts. This hierarchical view provides a clear overview of the web page's resources, facilitating efficient access to JS files and other assets.
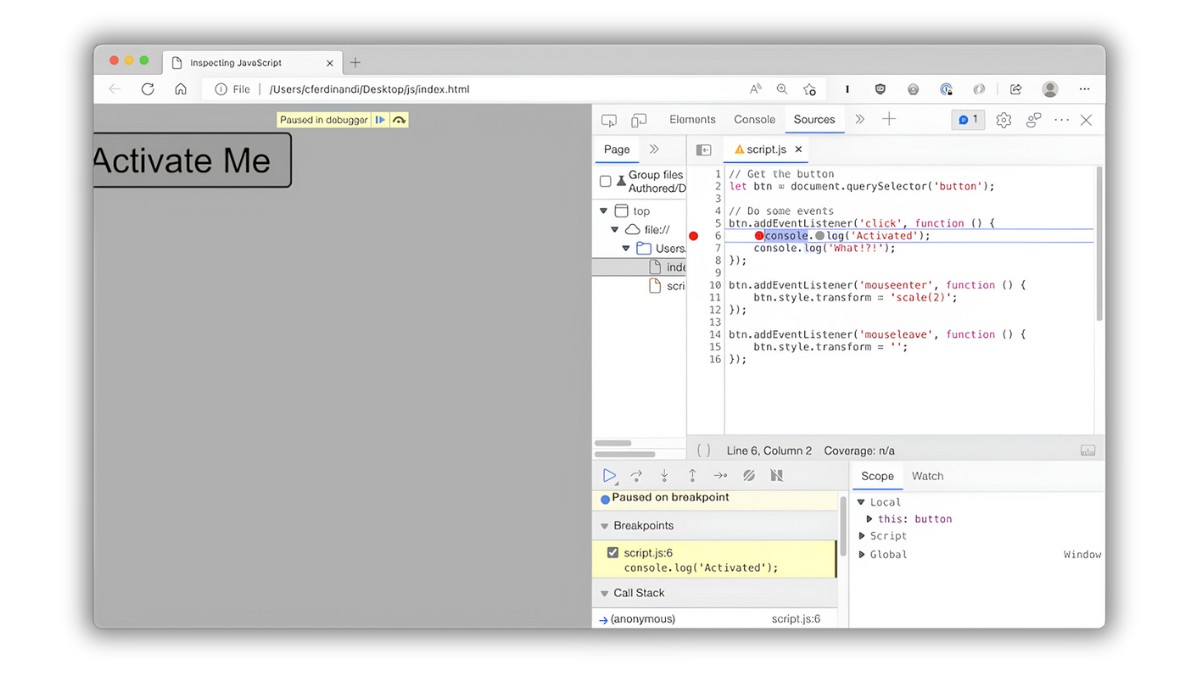
Furthermore, the Sources tab offers a powerful set of features for managing and debugging JS files, including the ability to set breakpoints, inspect variable values, and execute code snippets. By leveraging these features, you can gain valuable insights into the behavior of JavaScript code, identify potential issues, and streamline the debugging process. The seamless integration of these capabilities within the Sources tab empowers you to interact with JS files in real time, enabling efficient testing, debugging, and refinement of code.
Navigating to the Sources tab marks a pivotal moment in the process of running a JS file in Chrome, as it provides a comprehensive view of the web page's resources and empowers you to interact with JavaScript code seamlessly. With the Sources tab at your disposal, you are well-equipped to delve deeper into the intricacies of JS files, harnessing the browser's native capabilities to refine your code and enhance the functionality of web applications.
As we transition to the next steps, the foundation laid by navigating to the Sources tab will prove instrumental in facilitating a seamless and productive workflow for running JS files in Chrome, empowering you to unleash the true power of JavaScript within the browser environment.
Step 4: Add JS File to Workspace
Adding a JavaScript (JS) file to the workspace within the Chrome browser is a pivotal step in the process of running and interacting with JS code. By incorporating the JS file into the workspace, developers gain the ability to seamlessly edit, debug, and execute the code within the familiar and powerful environment of Chrome's Developer Tools.
To add a JS file to the workspace, you can leverage the intuitive capabilities of Chrome's Developer Tools. Upon navigating to the Sources tab within Developer Tools, you can locate the desired JS file either through the file tree view or by utilizing the search functionality. Once the JS file is identified, you can right-click on it to reveal a contextual menu, where you will find the option to "Add folder to workspace" or "Map to network resource," depending on the specific context.
Selecting the "Add folder to workspace" option initiates the process of integrating the JS file into the workspace, establishing a direct link between the file on your local machine and the browser environment. This seamless integration enables you to make real-time edits to the JS file directly within the browser, without the need to switch between different applications or environments. The ability to edit and modify the JS code within the familiar interface of Chrome's Developer Tools streamlines the development and debugging process, empowering you to refine the code with ease.
Furthermore, adding the JS file to the workspace unlocks a range of powerful features within Developer Tools, including the ability to set breakpoints, inspect variable values, and execute code snippets. These capabilities facilitate efficient testing and debugging of the JS code, providing valuable insights into its behavior and enabling you to identify and address potential issues effectively.
By incorporating the JS file into the workspace, you establish a seamless connection between your local development environment and the browser, creating a unified platform for refining and testing JS code. This integration streamlines the development workflow, allowing you to leverage the full potential of Chrome's Developer Tools to enhance the functionality and performance of your JavaScript code.
As we proceed to the next steps, the foundation laid by adding the JS file to the workspace will prove instrumental in facilitating a seamless and productive workflow for running JS files in Chrome, empowering you to unlock the true potential of JavaScript within the browser environment.
Step 5: Run the JS File
Running a JavaScript (JS) file within the Chrome browser is the culmination of the seamless integration and preparation steps undertaken in the preceding stages. Once the JS file is added to the workspace and the necessary modifications or debugging tasks have been completed, the final step involves executing the JS code to observe its behavior and validate the changes made. This pivotal action not only provides immediate feedback on the code's functionality but also serves as a crucial validation step in the development and debugging process.
To run the JS file, you can leverage the powerful capabilities of Chrome's Developer Tools. With the JS file already added to the workspace, you can navigate to the Sources tab and locate the specific file within the file tree view. Once the file is identified, you can initiate its execution by setting breakpoints, if necessary, and then triggering the execution process. This can be achieved by clicking on the "Run" button or utilizing the keyboard shortcuts available within Developer Tools.
Upon running the JS file, the Developer Tools interface provides real-time feedback on the code's execution, allowing you to monitor its behavior, inspect variable values, and identify any potential issues that may arise during the execution process. This invaluable insight into the code's runtime behavior empowers you to validate the changes made, test new features, or troubleshoot any existing issues, all within the familiar and intuitive environment of Chrome's Developer Tools.
Furthermore, the ability to run the JS file within the browser environment facilitates seamless integration with the web page, allowing you to observe the code's impact on the overall functionality and user experience. Whether you are refining the behavior of interactive elements, optimizing performance, or implementing new features, running the JS file in Chrome provides a comprehensive view of its impact on the web page, enabling you to make informed decisions and iterate on the code as needed.
By executing the JS file within the Chrome browser, you complete the development and debugging cycle, gaining valuable insights into the code's behavior and its impact on the web page. This final step not only validates the changes made but also sets the stage for further refinement and enhancement of the JavaScript code, empowering you to deliver robust and engaging web experiences through seamless integration of JS files within the browser environment.