Introduction
Welcome to the exciting world of trading! If you’re new to the game, you might have come across the term ‘FIB’ or ‘Fibonacci’ in trading discussions. But what exactly does FIB mean and how is it used in the trading world? In this article, we will dive into the world of FIB to unravel its significance and application in trading.
FIB, derived from the name Leonardo Fibonacci, is a popular tool used by traders to identify potential support and resistance levels in financial markets. It is based on the Fibonacci sequence, a mathematical concept discovered by Fibonacci in the 13th century. The Fibonacci sequence is a series of numbers where each number is the sum of the two preceding ones (e.g., 0, 1, 1, 2, 3, 5, 8, 13, and so on).
Traders utilize various aspects of FIB, including Fibonacci retracements, extensions, fans, and time zones to identify key price levels, trends, and potential reversal points. By analyzing these Fibonacci-based indicators, traders can make more informed decisions to enter or exit trades, manage risk, and improve their overall trading strategies.
FIB has gained popularity among traders due to its ability to provide objective levels of support and resistance based on mathematical ratios. These ratios, derived from the Fibonacci sequence, have proven to be relevant and effective in various financial markets, including stocks, forex, commodities, and cryptocurrencies.
In the following sections, we will explore the different ways FIB is used in trading and how each tool can be applied to enhance your trading analysis. Whether you’re a beginner or an experienced trader, understanding FIB can give you a valuable edge in the competitive world of trading.
Definition of FIB in Trading
FIB, short for Fibonacci, is a powerful tool used in trading to identify key levels of support and resistance in financial markets. It is based on the Fibonacci sequence, a numerical series discovered by Leonardo Fibonacci in the 13th century. The Fibonacci sequence is a sequence of numbers where each number is the sum of the two preceding ones. For example, the sequence begins with 0 and 1, and subsequent numbers are obtained by adding the two previous numbers together (e.g., 0, 1, 1, 2, 3, 5, 8, 13, and so on).
Traders use FIB to identify potential price levels where the market is likely to reverse or consolidate. FIB tools make use of ratios derived from the Fibonacci sequence, such as 0.382, 0.618, and 1.618, to determine these levels. These ratios are believed to represent natural proportions found in various aspects of the natural world and can have significant implications in financial markets.
There are several FIB tools commonly used in trading:
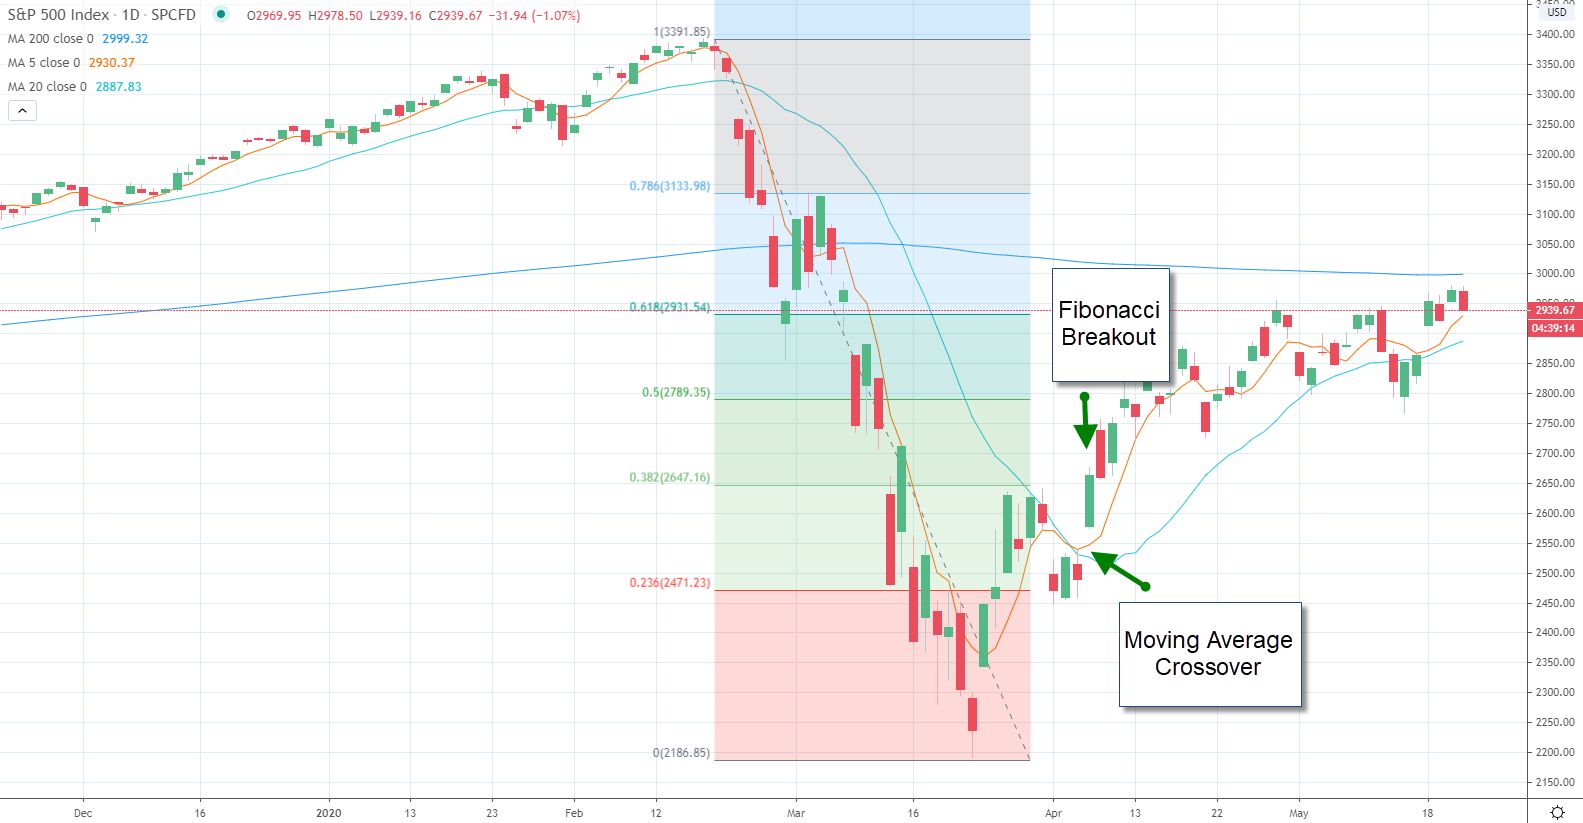
Fibonacci retracements: This tool helps traders identify potential support and resistance levels based on the Fibonacci ratios. By drawing trend lines between significant high and low points on a price chart, traders can calculate retracement levels where the price is likely to reverse.
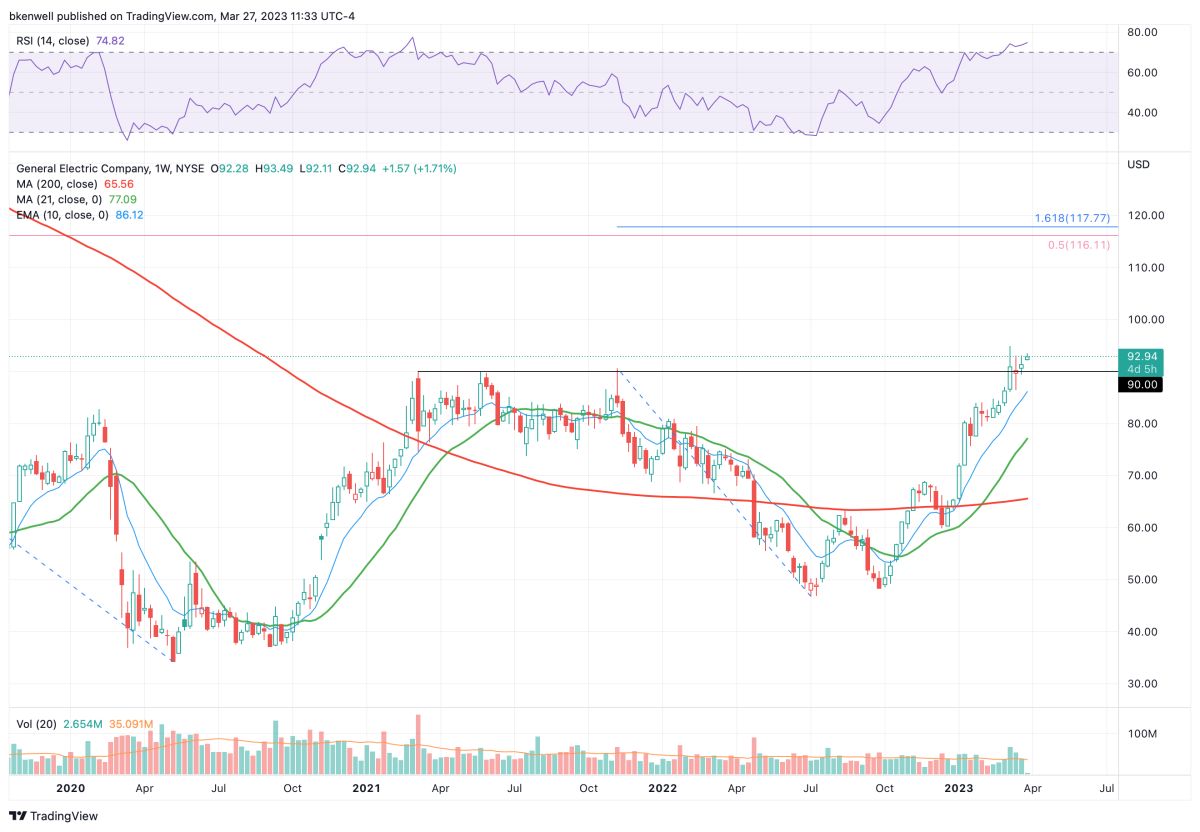
Fibonacci extensions: This tool allows traders to project potential price targets beyond the current price trend. By drawing extension levels based on the Fibonacci ratios, traders can anticipate where the price might reach if the trend continues.
Fibonacci fans: This tool helps traders identify diagonal support and resistance levels by drawing trend lines from a significant low or high point. The lines are then extended to create a fan-like pattern that indicates potential price areas of interest.
Fibonacci time zones: This tool incorporates time and price to predict potential reversal points in the market. Traders use Fibonacci ratios to divide the price and time movements on a chart into specific zones, where a change in trend may occur.
These FIB tools are widely used by traders to enhance their technical analysis and make better-informed trading decisions. By combining these tools with other indicators and strategies, traders gain a deeper understanding of price patterns, trends, and potential market turning points.
Understanding the definition and application of FIB in trading is essential for traders looking to improve their analysis and decision-making skills. Now, let’s explore how these FIB tools are used in practice to make more informed trading decisions.
How FIB is Used in Trading
FIB tools, based on the Fibonacci sequence, are widely used in trading to analyze price movements and identify potential areas of support and resistance. Let’s explore how each FIB tool is used in practice:
Fibonacci retracements: Traders use Fibonacci retracements to identify potential levels of support and resistance in a market. After identifying a major price swing, traders draw Fibonacci retracement levels (such as 38.2%, 50%, and 61.8%) from the swing low to the swing high. These levels indicate where the price is likely to retrace before continuing in the direction of the overall trend. Traders pay close attention to these levels as they can serve as potential areas to enter a trade or adjust stop loss orders.
Fibonacci extensions: Fibonacci extensions are used to project potential price targets in an existing trend. Traders draw Fibonacci extension levels (such as 127.2%, 161.8%, and 261.8%) from the swing low to the swing high. These levels indicate where the price might reach if the trend continues. Traders often use Fibonacci extensions to set profit targets or identify areas where the trend might reverse.
Fibonacci fans: Fibonacci fans help traders identify potential support and resistance levels using diagonal lines drawn from a significant low or high point. These fan lines extend into the future and create an area of convergence, indicating potential price levels of interest. Traders use Fibonacci fans to anticipate potential areas where the price might find support or encounter resistance, and adjust their trading strategies accordingly.
Fibonacci time zones: Fibonacci time zones combine price and time to identify potential reversal points. Based on the Fibonacci sequence, specific time zones are identified on a chart, representing potential turning points or periods of higher volatility. Traders use Fibonacci time zones in conjunction with other technical analysis tools to anticipate potential trend reversals or significant price movements.
By incorporating these FIB tools into their trading analysis, traders can identify potential entry and exit points, set profit targets, manage risk, and make more informed trading decisions. It’s important to note that FIB tools should not be used in isolation, but rather in conjunction with other technical indicators and analysis techniques to confirm signals and validate trading strategies.
Now that we’ve explored how FIB tools are used in trading, let’s discuss the benefits and limitations of using FIB in the financial markets.
Fibonacci Retracements
Fibonacci retracements are a popular tool used by traders to identify potential levels of support and resistance in a market. These retracement levels are derived from the Fibonacci sequence and serve as important price areas that traders monitor closely.
When using Fibonacci retracements, traders start by identifying a major price swing, typically from a swing low to a swing high in an uptrend, or from a swing high to a swing low in a downtrend. Once the swing points are identified, traders draw Fibonacci lines that represent key retracement levels, such as 38.2%, 50%, and 61.8%.
The Fibonacci retracement levels indicate the potential areas where the price is likely to retrace and potentially find support or resistance before continuing in the direction of the overall trend. Traders consider these levels as potential entry points, where they can initiate trades or add to existing positions.
For example, if a stock is in an uptrend and experiences a pullback, traders may look for the price to retrace to a Fibonacci retracement level, such as the 38.2% or 50% level, before considering it as a potential buying opportunity. These levels are considered areas of support, where buyers may step in and push the price higher.
Conversely, if a stock is in a downtrend and rallies, traders may watch for the price to retrace to a Fibonacci retracement level, such as the 38.2% or 50% level, before considering it as a potential selling opportunity. These levels are seen as areas of resistance, where sellers may enter the market and push the price lower.
Traders often use other technical analysis tools, such as trendlines, moving averages, or candlestick patterns, in conjunction with Fibonacci retracements to further validate potential support or resistance levels.
It’s important to note that Fibonacci retracements are not foolproof and should be used in conjunction with other indicators and analysis techniques. While these retracement levels can provide valuable guidance, they are not always precise. Market dynamics, news events, and other factors can influence price movements and negate the effectiveness of Fibonacci retracements.
By incorporating Fibonacci retracements into their trading analysis, traders can identify potential areas of support and resistance, make more informed trading decisions, and manage risk more effectively. It’s essential to combine Fibonacci retracement levels with other technical indicators and sound risk management strategies to enhance the probability of successful trades.
Now that we’ve explored Fibonacci retracements, let’s move on to discuss another important tool derived from the Fibonacci sequence: Fibonacci extensions.
Fibonacci Extensions
Fibonacci extensions are a powerful tool used by traders to project potential price targets beyond the current price trend. Derived from the Fibonacci sequence, these extension levels help traders identify areas where the price might reach if the trend continues.
To use Fibonacci extensions, traders start by identifying a major price swing, typically from a swing low to a swing high in an uptrend, or from a swing high to a swing low in a downtrend. Once the swing points are identified, traders draw Fibonacci lines that represent key extension levels, such as 127.2%, 161.8%, and 261.8%.
These extension levels indicate potential areas where the price could reach if the trend continues its momentum. Traders use Fibonacci extensions to set profit targets or identify areas where the trend might reverse.
For example, if a stock is in an uptrend and experiences a breakout above a significant resistance level, traders may use Fibonacci extensions to project potential price targets beyond the breakout level. The 127.2% or 161.8% extension levels are commonly used as profit targets. If the price reaches one of these levels, traders may consider closing their positions to take profits.
Conversely, if a stock is in a downtrend and rallies, traders may use Fibonacci extensions to project potential price targets on the upside. As the price approaches the 127.2% or 161.8% extension levels, traders may look for signs of resistance or reversals, signaling a potential opportunity to initiate short trades.
Traders often combine Fibonacci extensions with other technical analysis tools, such as trendlines, moving averages, or candlestick patterns, to confirm potential price targets and strengthen their trading decisions.
It’s important to note that Fibonacci extensions, like any other technical analysis tool, are not infallible. Market conditions, news events, and other factors can impact price movements and challenge the accuracy of Fibonacci extension levels.
By incorporating Fibonacci extensions into their trading analysis, traders can set profit targets, manage their trades more effectively, and potentially identify areas where the trend might reverse. It is crucial to combine Fibonacci extensions with other technical indicators and risk management strategies to increase the likelihood of successful trades.
Now, let’s continue our exploration of Fibonacci-based tools with Fibonacci fans.
Fibonacci Fans
Fibonacci fans are a popular tool used by traders to identify potential support and resistance levels in a market using diagonal lines. Based on the Fibonacci sequence, these fan lines help traders visualize potential price areas of interest.
To use Fibonacci fans, traders start by identifying a significant low or high point on the chart. They then draw diagonal trend lines that originate from the starting point and extend into the future. These trend lines are drawn at specific angles, typically based on the Fibonacci ratios of 38.2%, 50%, and 61.8%.
The resulting fan-like pattern created by the lines indicates potential support and resistance levels that traders monitor closely. The area where fan lines converge can be considered a significant zone where the price is likely to find support or face resistance.
Traders use Fibonacci fans to anticipate potential areas where the price might reverse or find significant levels of buying or selling pressure. This information can be valuable for making trading decisions, adjusting stop-loss orders, or identifying areas to take profits.
For example, if a stock is in an uptrend and experiences a pullback, traders may draw Fibonacci fan lines from the significant low point to the swing high. The fan lines can help identify potential levels where the price might find support as it retraces before resuming the upward trend.
Conversely, if a stock is in a downtrend and rallies, traders may draw Fibonacci fan lines from the significant high point to the swing low. The fan lines can help identify potential levels where the price might encounter resistance as it retraces before continuing its downtrend.
Traders often combine Fibonacci fans with other technical analysis tools, such as trendlines, moving averages, or candlestick patterns, to confirm potential levels of support or resistance and strengthen their trading decisions.
It’s important to note that Fibonacci fans, while useful, are not foolproof indicators and should be used alongside other analysis techniques. Market dynamics, news events, and other factors can influence price movements and invalidate the effectiveness of Fibonacci fan lines.
By incorporating Fibonacci fans into their trading analysis, traders can better identify potential areas of support and resistance, improve their market understanding, and make more informed trading decisions. It’s crucial to combine Fibonacci fans with other technical indicators and risk management strategies to increase the odds of successful trades.
Now, let’s move on to the next tool derived from the Fibonacci sequence: Fibonacci time zones.
Fibonacci Time Zones
Fibonacci time zones are a tool used by traders to predict potential reversal points and periods of higher volatility in the market. By combining price and time, Fibonacci time zones help traders identify specific time intervals where a change in trend may occur.
To use Fibonacci time zones, traders begin by selecting a significant high or low point on the price chart. They then draw vertical lines at specific intervals based on the Fibonacci ratios, such as 38.2%, 50%, and 61.8%. These lines divide the price movement on the chart into different time zones.
Traders use Fibonacci time zones to anticipate potential reversal or continuation points in the market. The theory behind this tool is that price movements often correlate with specific time intervals based on the Fibonacci sequence.
For example, if a stock is in an uptrend and experiences a significant price surge, traders may use Fibonacci time zones to predict potential periods of consolidation or reversal. They look for potential reversal points where multiple time zones converge, indicating a higher likelihood of trend reversal. Conversely, if a stock is in a downtrend, Fibonacci time zones can help traders anticipate potential periods of extended downward movement or volatility.
Traders often use Fibonacci time zones in conjunction with other technical analysis tools, such as support and resistance levels, trendlines, or candlestick patterns, to validate potential reversal or continuation signals.
It’s important to note that Fibonacci time zones should not be used as standalone indicators. Market conditions, news events, and other factors can impact price movements and challenge the accuracy of Fibonacci time intervals.
By incorporating Fibonacci time zones into their trading analysis, traders can better understand potential trend reversal points, anticipate periods of increased volatility, and make more informed trading decisions. It’s crucial to combine Fibonacci time zones with other technical indicators and risk management strategies to enhance the probability of successful trades.
Now that we have discussed the various Fibonacci-based tools, let’s explore the pros and cons of using FIB in trading.
Pros and Cons of Using FIB in Trading
Using Fibonacci tools in trading can offer several benefits, but it is important to consider the potential drawbacks as well. Let’s explore the pros and cons of using Fibonacci tools in your trading analysis:
Pros:
1. Objective Levels of Support and Resistance: Fibonacci tools provide objective levels of support and resistance based on mathematical ratios derived from the Fibonacci sequence. This can help traders identify key price levels where the market is likely to reverse or consolidate.
2. Widely Used and Recognized: Fibonacci tools are widely used and recognized by traders across different financial markets. This popularity means that many traders incorporate Fibonacci analysis into their strategies, potentially creating self-fulfilling prophecies and increasing the effectiveness of these tools.
3. Enhances Technical Analysis: Fibonacci tools complement and enhance other technical analysis techniques, such as trendlines, moving averages, and candlestick patterns. By combining different tools, traders can gain a more comprehensive view of price patterns, trends, and potential turning points.
4. Versatility Across Markets and Timeframes: Fibonacci tools can be applied to various financial markets, including stocks, forex, commodities, and cryptocurrencies. Additionally, they can be used across different timeframes, from short-term intraday charts to long-term charts, making them adaptable for traders with different trading styles.
Cons:
1. Subject to Interpretation: The effectiveness of Fibonacci tools can vary depending on how they are interpreted and applied. Traders may have different opinions on which swing points to use or how to draw the lines, leading to subjective analysis and potentially differing outcomes.
2. Not Always Precise: While Fibonacci tools provide valuable guidance, they are not always precise in identifying exact levels of support or resistance. Market dynamics, news events, and other factors can influence price movements and challenge the accuracy of Fibonacci-based analysis.
3. Reliance on Past Data: Fibonacci tools are based on historical price data, which may not necessarily reflect future market behavior. Traders should be cautious of relying solely on past data and consider other factors, such as current market conditions and fundamental analysis.
4. Overuse and Self-Fulfilling Prophecies: Due to their popularity, Fibonacci tools may be overused by traders, leading to self-fulfilling prophecies. When too many traders use the same Fibonacci levels, it can result in crowded trades and increased market volatility, potentially impacting the effectiveness of these tools.
It’s important to understand the pros and cons of using Fibonacci tools in trading and remember that they are just one component of a comprehensive trading strategy. Traders should combine Fibonacci analysis with other technical indicators, fundamental analysis, and risk management techniques to make well-informed trading decisions.
Now that we’ve examined the pros and cons of using Fibonacci tools, let’s summarize the key points discussed in this article.
Conclusion
FIB, or Fibonacci, tools have become invaluable for traders seeking to better understand price movements and identify potential areas of support, resistance, and trend reversals. These tools, derived from the Fibonacci sequence, offer objective levels and ratios that can enhance technical analysis and foster more informed trading decisions.
Throughout this article, we explored the different aspects of FIB in trading, including Fibonacci retracements, extensions, fans, and time zones. Each tool serves a unique purpose, providing traders with valuable insights into price patterns, trend continuation or reversal points, and potential profit targets.
While FIB tools offer several advantages, it is important to acknowledge their limitations. Traders should not solely rely on Fibonacci analysis but rather combine it with other technical indicators, fundamental analysis, and risk management strategies. This comprehensive approach can help overcome any subjective interpretations and increase the likelihood of successful trades.
By incorporating FIB tools into their trading analysis, traders gain a deeper understanding of market dynamics and become more adept at identifying potential entry and exit points. Additionally, understanding the pros and cons of using FIB tools allows traders to apply these tools effectively and guard against potential pitfalls.
Whether you are a beginner or an experienced trader, recognizing the significance of FIB in trading can provide you with a valuable edge in the dynamic world of financial markets. As you integrate FIB analysis into your trading strategy, continue to educate yourself, practice effective risk management, and adapt to changing market conditions.
With the proper utilization of FIB tools and a well-rounded approach to trading, you can navigate the markets with greater confidence and improve your overall trading performance. Embrace the power of FIB tools and embark on a journey of continuous learning and growth as a trader.