What Is ATR In Trading
Introduction
When it comes to trading in the financial markets, understanding and analyzing market volatility is of utmost importance. One widely used indicator for measuring volatility is the Average True Range (ATR). ATR provides traders with valuable insights into how much an asset typically moves within a given time period.
ATR is a useful tool that can help traders make informed decisions about entry and exit points, as well as managing risk. By understanding the fluctuations in price movements, traders can gain a better understanding of potential profits and losses.
In this article, we will explore what ATR is, how it is calculated, and the importance of ATR in trading strategies. We will also look at various ways to use ATR in different aspects of trading analysis. Whether you are a beginner or an experienced trader, understanding ATR can significantly enhance your trading decisions.
What is ATR?
The Average True Range (ATR) is a technical analysis indicator that measures market volatility. Developed by J. Welles Wilder Jr., the ATR represents the average range between the high and low prices of an asset over a specified period.
Unlike other indicators that focus solely on price movements, the ATR considers the volatility of an asset. It takes into account gaps and limit moves, which can be particularly useful in markets with significant overnight price fluctuations.
The ATR is expressed in the same units as the underlying asset and can be used on any financial instrument, including stocks, forex, commodities, and cryptocurrencies. It is typically displayed as a line chart or overlaid on the price chart to provide a visual representation of volatility.
Traders use ATR to gain insights into potential price movements. By understanding the average range of an asset, traders can anticipate how much it is likely to move in the future. This information can be used to set profit targets, determine stop-loss levels, and adjust position sizes accordingly.
It’s important to note that ATR is not a directional indicator—it doesn’t provide information on whether the price will go up or down. Instead, it focuses on the magnitude of price movements and helps traders make informed decisions based on volatility.
Now that we’ve covered the basics of ATR, let’s dive into how it’s calculated and why it is important in trading strategies.
How is ATR calculated?
The Average True Range (ATR) is calculated using a straightforward formula. It involves taking the average of the True Range (TR) over a specific period. The TR is the greatest of the following three values:
- The difference between the current high and the current low
- The absolute value of the difference between the current high and the previous close
- The absolute value of the difference between the current low and the previous close
Once the TR is calculated, the ATR is obtained by averaging the TR values over a predetermined number of periods. Commonly used periods for calculating ATR include 14, 20, or 50. The higher the period, the smoother the ATR line will appear.
For example, if we choose a 14-day ATR calculation for a stock, we would first calculate the TR for each day over the past 14 days. Then, we would average these daily TR values to obtain the ATR for that particular day. The process is repeated for each subsequent day, taking into account the latest 14-day period.
It’s worth mentioning that different trading platforms and charting software may have built-in ATR indicators, so traders don’t have to manually calculate the ATR value themselves. These tools provide a convenient way to overlay the ATR on the price chart, making it easier to interpret and incorporate into trading strategies.
Understanding how ATR is calculated is essential because it gives traders the ability to adjust the indicator parameters based on their preferred time frame and trading style. By experimenting with different periods, traders can determine which ATR setting works best for their analysis.
Now that we have covered how ATR is calculated, let’s explore the importance of ATR in trading strategies and decision-making.
Why is ATR important in trading?
The Average True Range (ATR) is a vital tool for traders, as it provides valuable insights into market volatility. Here are some key reasons why ATR is important in trading strategies:
- Volatility Measurement: ATR helps traders gauge the volatility of an asset. By knowing the average range, traders can understand the potential price movements and adjust their strategies accordingly. ATR is particularly useful in identifying periods of high volatility versus low volatility, which can influence trading decisions.
- Trend Identification: ATR can be used to identify strong trends. When the ATR value is high, it indicates that the asset is experiencing significant price swings, indicating a potentially strong trend. Conversely, a low ATR value suggests a lack of volatility and a potential consolidation or sideways market.
- Setting Profit Targets and Stop Losses: ATR is valuable in setting realistic profit targets and stop-loss levels. Traders can use the ATR value to determine how much room they need to give their trades, taking into account the normal fluctuations in price. ATR can help in placing stops at appropriate levels to avoid unnecessary stop-outs and protect profits.
- Position Sizing: ATR is also beneficial for position sizing. Traders can use the ATR value to calculate the appropriate size of their positions based on their risk tolerance and money management strategy. Higher ATR values may require smaller position sizes to account for increased volatility, while lower ATR values may warrant larger positions.
- Identifying Breakouts: ATR can be used to identify potential breakout opportunities. When the ATR value is rising, it suggests an increase in volatility and the possibility of a breakout from a trading range. Traders can use this information to anticipate potential entry points for breakout strategies.
By incorporating ATR into their trading analysis, traders can make more informed decisions, manage risk effectively, and adapt their strategies to changing market conditions. ATR provides essential information about volatility, which is a critical factor in successful trading.
In the next sections, we will dive deeper into various ways ATR can be used in trend analysis, volatility analysis, determining stop-loss levels, and position sizing.
How can ATR be used?
The Average True Range (ATR) is a versatile indicator that can be employed in various ways to enhance trading strategies. Here are some common applications of ATR in trading:
- ATR in Trend Analysis: ATR can help identify and confirm trends in the market. When the ATR value increases, it suggests an increase in volatility, which often accompanies a strong trend. Traders can use ATR to confirm the strength of a trend and adjust their trading approach accordingly.
- ATR in Volatility Analysis: ATR provides valuable insights into market volatility levels. Traders can compare the current ATR value to historical data to determine whether volatility is high or low. This information is crucial for selecting appropriate trading strategies, as higher volatility may warrant more aggressive trading approaches, while lower volatility may require more conservative tactics.
- ATR in Determining Stop-Loss Levels: ATR is helpful in setting optimal stop-loss levels. By multiplying the ATR value with a predetermined factor (such as 1.5 or 2), traders can determine the distance from the entry point that provides a reasonable buffer against normal price fluctuations. This approach allows traders to give their trades enough room to breathe while managing risk effectively.
- ATR in Position Sizing: ATR is valuable in determining the appropriate position size for trades. By calculating the percentage of account risk based on the ATR value, traders can adjust their position size to ensure they are not risking more than a predetermined amount per trade. This risk management technique helps protect capital and maintain consistency in trading performance.
It’s important to note that ATR can be used in combination with other technical indicators to validate trading signals and provide additional confirmation. For example, combining ATR with moving averages or oscillators can provide a comprehensive analysis of market conditions.
Furthermore, different time frames can be used when applying ATR to trading strategies. Shorter periods, such as daily or hourly, can be useful for intraday trading or scalping, while longer periods, such as weekly or monthly, can be beneficial for swing or position trading.
By utilizing ATR in these various ways, traders can gain a better understanding of the market, make more informed trading decisions, and improve their overall trading performance.
ATR in trend analysis
The Average True Range (ATR) is a valuable tool for trend analysis. By measuring market volatility, ATR helps identify and confirm trends. When the ATR value increases, it indicates an increase in volatility, which often accompanies a strong trend.
Traders can use ATR in trend analysis in the following ways:
- Confirming Trend Strength: ATR can confirm the strength of a trend. When the ATR value is rising, it suggests that the market is becoming more volatile, indicating a potential continuation of the trend. Traders can use the increasing ATR value to validate the strength of the trend they are considering trading.
- Identifying Trend Reversals: A sudden decrease in ATR value may signify a potential trend reversal. When the ATR value decreases, it indicates a decline in volatility, suggesting that the current trend may be losing momentum. Traders can use this information to anticipate a possible trend reversal and adjust their trading strategies accordingly.
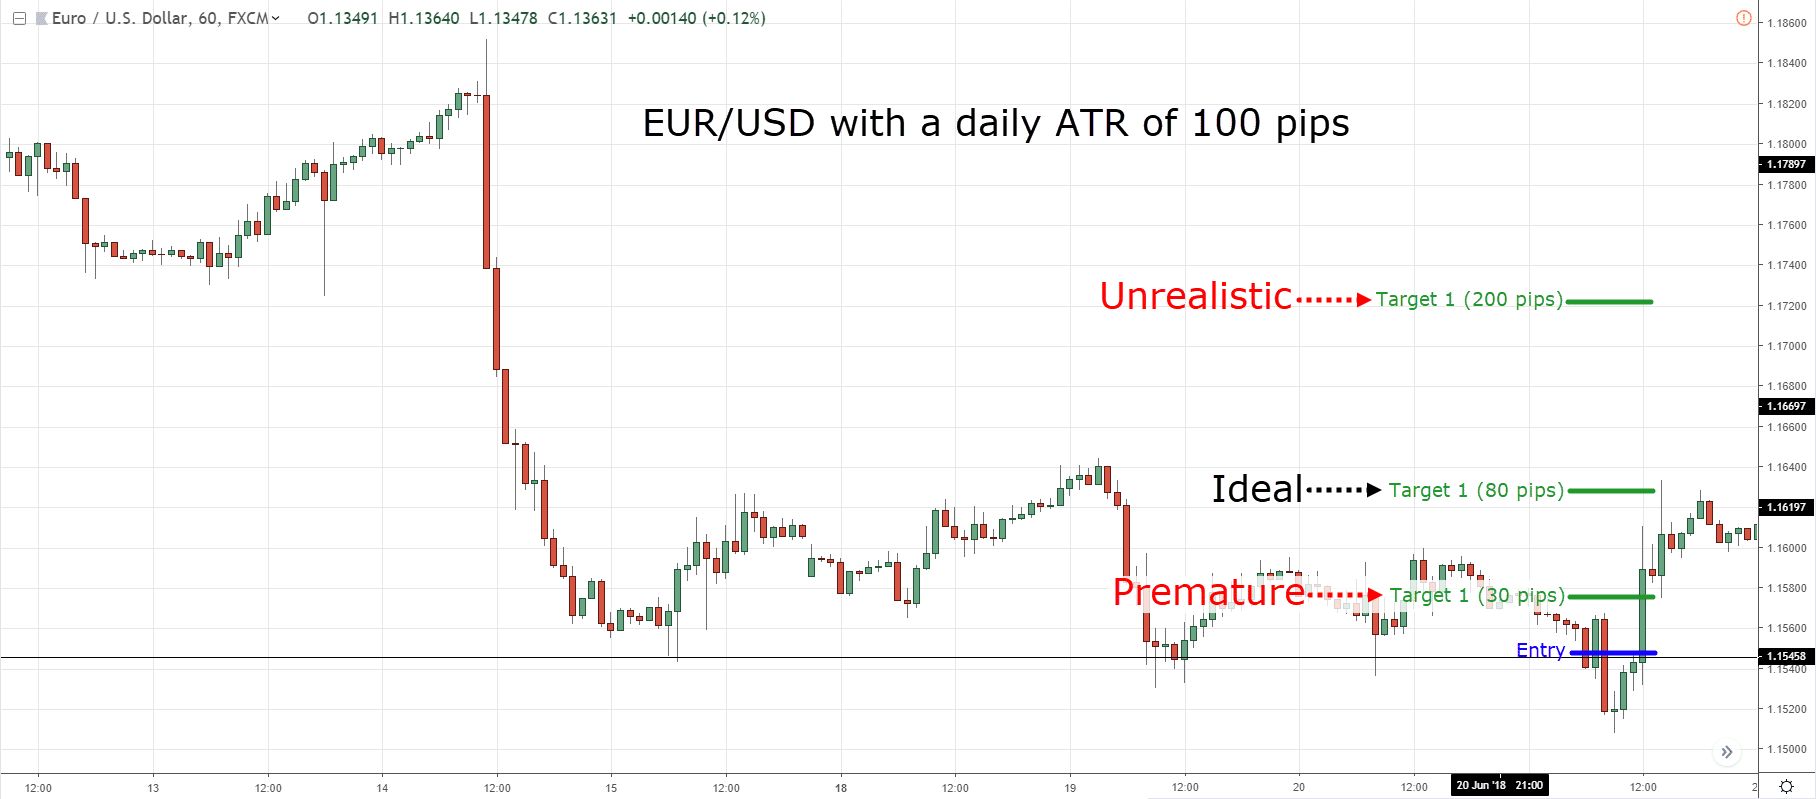
- Setting Profit Targets: ATR can help in setting realistic profit targets during trending markets. By understanding the average range of price movements, traders can set profit targets that align with the volatility of the asset. For example, a trader may choose to set a profit target at two times the current ATR value, allowing for potential price fluctuations while still aiming for a reasonable profit.
- Trailing Stop Loss: ATR can be used to establish a trailing stop loss during trends. Traders can set a stop loss level below or above the recent low or high, respectively, with a distance equal to a multiple of the ATR value. This trailing stop loss method allows traders to capture profits while giving the trade enough room to breathe in case of regular price fluctuations.
It’s important to note that ATR should be used in conjunction with other trend-following indicators or chart patterns to validate trading signals and increase the accuracy of trend analysis. Combining ATR with moving averages or trendline analysis can provide a comprehensive view of overall market conditions.
By incorporating ATR into trend analysis, traders can gain valuable insights into the strength and potential reversals of trends, helping them make informed trading decisions and improve their overall trading performance.
ATR in volatility analysis
The Average True Range (ATR) is an essential tool for analyzing market volatility. By measuring the range of price movements, ATR provides valuable insights into the level of volatility in the market at any given time. Traders can use ATR in volatility analysis to make informed decisions and adapt their trading strategies effectively.
Here are some ways ATR can be used in volatility analysis:
- Comparing Volatility: ATR allows traders to compare the volatility of different assets or markets. By analyzing the ATR values across various instruments, traders can identify which assets are more volatile, helping them select the most suitable trading opportunities based on their risk tolerance and preferred trading style.
- Identifying High Volatility Periods: ATR helps to identify periods of high and low volatility. When the ATR value is high, it indicates that the market is experiencing significant price fluctuations. Traders can use this information to adjust their strategies accordingly, such as implementing more aggressive trading approaches or widening their profit targets and stop-loss levels.
- Adapting Trading Strategy: ATR allows traders to adapt their trading strategies based on the current market volatility. During periods of high volatility, traders may choose to use shorter timeframes or employ more volatile strategies such as breakouts or momentum trading. Conversely, during periods of low volatility, traders may opt for longer timeframes or utilize range-bound strategies.
- Managing Risk: ATR helps traders manage risk effectively. By understanding the average range of price movements, traders can set appropriate stop-loss levels that account for normal volatility. ATR can also be used to adjust position sizes based on the current level of volatility, ensuring that the risk exposure is aligned with market conditions.
It’s important to remember that ATR is just one tool in volatility analysis and should be used alongside other technical indicators or chart patterns to validate trading signals. Combining ATR with Bollinger Bands or other volatility-based indicators can provide additional insights into market volatility and enhance trading decisions.
By incorporating ATR into volatility analysis, traders can gain a better understanding of market conditions, make more informed trading decisions, and adjust their strategies to suit the level of volatility in the market.
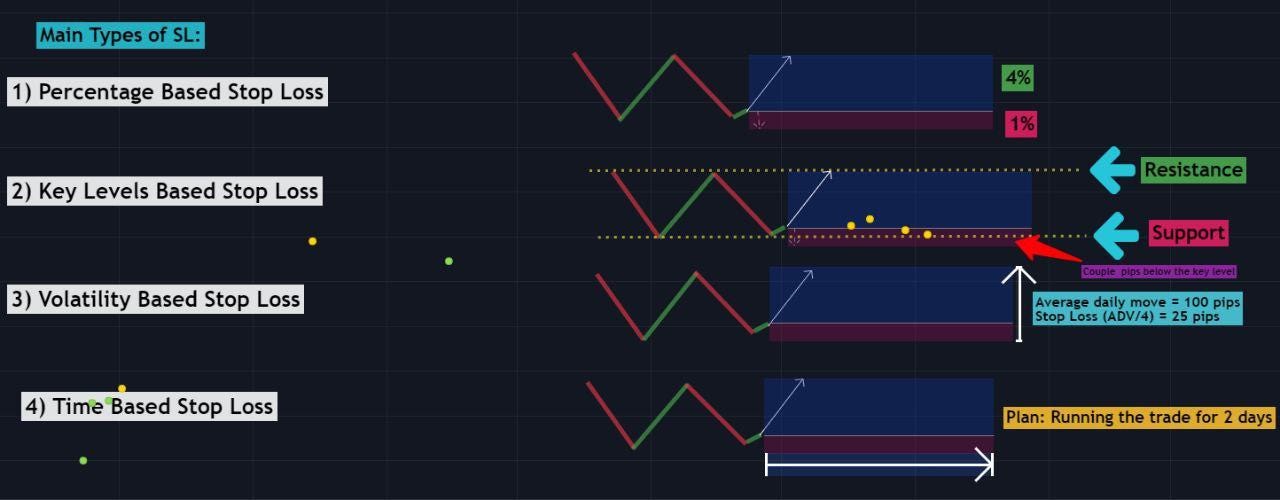
ATR in determining stop-loss levels
The Average True Range (ATR) is a valuable tool for determining optimal stop-loss levels in trading. By measuring the average range of price movements, ATR provides insights into the normal fluctuations an asset can experience within a given time frame. Traders can use ATR in calculating stop-loss levels to manage risk effectively and protect their positions.
Here’s how ATR can be used in determining stop-loss levels:
- Volatility-Based Stop Loss: ATR allows traders to set stop-loss levels that account for the asset’s normal price fluctuations. By multiplying the ATR value with a predetermined multiple (e.g., 1.5 or 2), traders can establish a stop-loss distance that provides a buffer against regular market volatility. This approach helps prevent unnecessary stop-outs due to normal price oscillations.
- Adapting Stop Loss to Volatility: ATR helps traders adjust their stop-loss levels based on the current level of volatility in the market. If the ATR value is high, indicating increased volatility, traders may choose to widen their stop-loss levels to give the trade enough room to move. Conversely, during periods of low volatility, traders may tighten their stop-loss levels to minimize potential losses.
- Trailing Stop Loss: ATR can also be used to set trailing stop-loss levels. Traders can trail their stop-loss levels by a multiple of the ATR value as the trade moves in their favor. This allows traders to protect their profits by capturing a portion of the gains while giving the trade enough room to breathe and potentially capture larger profits if the trend continues.
- Varying Stop Loss Across Different Time Frames: ATR can be utilized to set stop-loss levels based on different time frames. For example, traders may set tighter stop losses on shorter time frames to manage intraday volatility, while using wider stop-loss levels on longer time frames to account for larger price swings.
It’s important to note that stop-loss levels should be established based on individual risk tolerance, trading strategy, and the specific market conditions. ATR provides a systematic way to determine stop-loss levels that align with market volatility and help preserve capital.
By incorporating ATR in determining stop-loss levels, traders can effectively manage risk, protect their positions, and enhance their overall trading performance.
ATR in position sizing
The Average True Range (ATR) is a useful tool for determining position sizes in trading. By measuring the volatility of an asset, ATR provides valuable insights into the potential range of price movements. Traders can utilize ATR in position sizing to ensure that their risk exposure is aligned with market conditions and their risk management strategy.
Here’s how ATR can be used in position sizing:
- Calculating Risk Percentage: ATR helps traders calculate the percentage of their account that is at risk for each trade. By multiplying the ATR value with a predetermined risk percentage (e.g., 1% or 2%), traders can determine the amount of capital they are willing to risk on a particular trade. This approach ensures that position sizes are adjusted based on the current level of market volatility.
- Adapting Position Size to Volatility: ATR assists traders in adjusting their position sizes based on the volatility of the market. Higher ATR values indicate increased volatility, suggesting that traders may want to reduce their position sizes to account for potential larger price swings. Conversely, lower ATR values may allow for larger position sizes as the market is experiencing lower volatility.
- Risk-Adjusted Sizing: ATR enables traders to implement risk-adjusted position sizing. By using the ATR value, traders can calculate the stop-loss distance for each trade. The position size can then be determined by dividing the maximum risk allowed by the stop-loss distance. This method ensures that position sizes are adjusted based on the specific risk-reward ratio of the trade.
- Scaling-In and Scaling-Out: ATR is valuable for traders who prefer scaling-in or scaling-out of positions. By using ATR, traders can determine the size of each scale-in or scale-out order based on the current volatility of the asset. This approach allows traders to adjust their position sizes as the market evolves.
It’s important to note that position sizing should be determined based on individual risk tolerance, trading strategy, and the specific market conditions. ATR provides a quantitative way to adjust position sizes, ensuring that risk exposure aligns with market volatility.
By incorporating ATR in position sizing, traders can effectively manage risk, protect their capital, and optimize their trading performance for different market conditions.
Conclusion
The Average True Range (ATR) is an invaluable tool for traders in analyzing market volatility and making informed trading decisions. ATR provides insights into price fluctuations, helps identify trends, and assists in risk management strategies.
By understanding how ATR is calculated and its various applications, traders can enhance their trading strategies in several ways. ATR can be used in trend analysis to confirm trend strength and anticipate trend reversals. Moreover, it is instrumental in volatility analysis, allowing traders to adapt their strategies to high or low volatility environments.
ATR also plays a crucial role in determining optimal stop-loss levels, allowing traders to manage risk effectively and protect their positions. Additionally, it assists in position sizing by aligning position sizes with market volatility, ensuring that traders are not exposed to excessive risk.
It’s essential to remember that ATR works best when used in conjunction with other technical indicators and chart patterns. Additionally, individual risk tolerance, trading style, and market conditions should be considered when implementing ATR in trading strategies.
By incorporating ATR into their trading analysis, traders can gain valuable insights, make more informed decisions, and adapt their strategies to changing market conditions. ATR is a key tool in the trader’s toolbox for managing risk, optimizing position sizes, and ultimately improving their trading performance.