Introduction
Welcome to the exciting world of pivot points in trading! If you are new to trading or looking to enhance your trading strategy, understanding pivot points can be a valuable tool in your arsenal.
Pivot points are widely used by traders and investors to determine potential levels of support and resistance in the financial markets. They act as reference points to anticipate price movements and make informed trading decisions.
In this article, we will explore what pivot points are, how they are calculated, different types of pivot points, and how to use them effectively in your trading strategy. But before we delve into the details, let’s first define what pivot points actually are.
Pivot points are mathematical calculations derived from previous price data, such as the high, low, and closing prices of a specific time period, typically the previous day’s trading session. These calculations provide traders with potential levels of support and resistance for the current or upcoming trading session.
By identifying these key levels, traders can determine potential entry and exit points, set stop-loss and take-profit levels, and manage their risk effectively. Pivot points can be particularly useful in short-term trading strategies, such as day trading or swing trading, where quick decisions are required based on intraday price movements.
Now that we have a basic understanding of what pivot points are, let’s dive into the calculation process.
What Are Pivot Points?
Pivot points are a popular technical analysis tool used in trading to identify potential levels of support and resistance. Essentially, they are calculated based on the previous trading session’s high, low, and closing prices and can help traders predict future price movements.
The concept of pivot points revolves around the idea that the market tends to gravitate towards certain price levels. These levels are determined by calculating the average of the high, low, and closing prices of the previous session, as well as additional levels derived from this average.
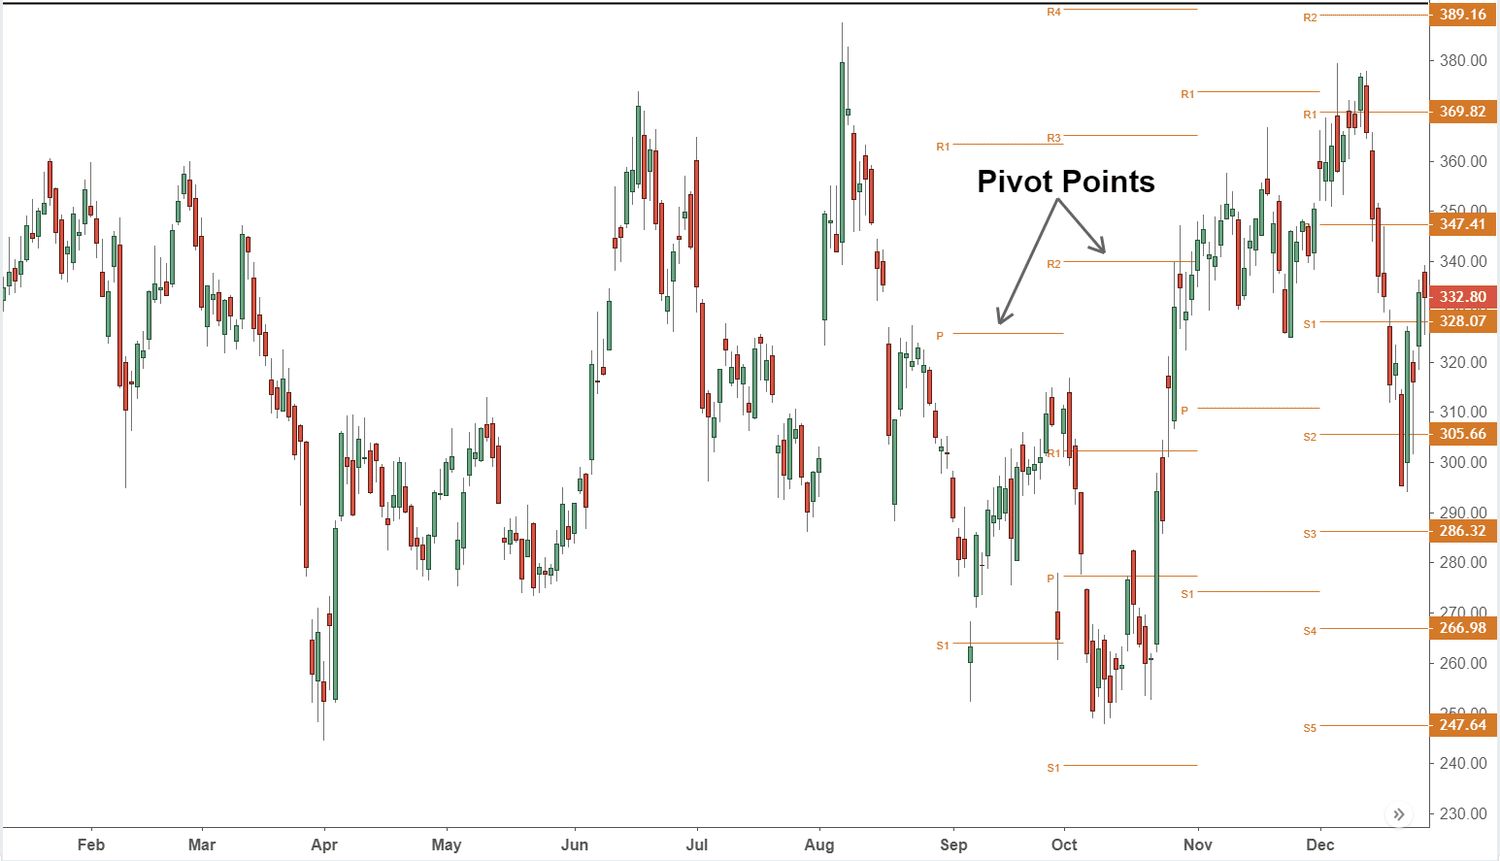
The pivot point itself is the central or “main” level, which serves as a reference point for potential support and resistance. This level is often denoted as “P” on trading platforms. Above the pivot point, three resistance levels are calculated, commonly referred to as R1, R2, and R3. Below the pivot point, three support levels are calculated, known as S1, S2, and S3.
The formula for calculating pivot points is as follows:
Pivot Point (P) = (High + Low + Close) / 3
Once the pivot point is determined, the additional levels can be calculated:
Resistance 1 (R1) = (2 x P) – Low
Resistance 2 (R2) = P + (High – Low)
Resistance 3 (R3) = High + 2 x (P – Low)
Support 1 (S1) = (2 x P) – High
Support 2 (S2) = P – (High – Low)
Support 3 (S3) = Low – 2 x (High – P)
These calculated levels can act as potential price targets, areas of support or resistance, and decision points for traders. By identifying these levels, traders can anticipate potential price reversals, breakouts, and trend continuations.
It’s important to note that pivot points are typically used on daily charts, but they can also be applied to shorter timeframes, such as hourly or 15-minute charts, for intraday trading.
In the next section, we will take a closer look at the different types of pivot points and how they can be used in trading strategies.
Calculation of Pivot Points
The calculation of pivot points involves a straightforward mathematical formula that utilizes the high, low, and closing prices of a previous trading session. By following this formula, traders can determine the pivot point and additional levels of support and resistance.
Let’s break down the calculation process step by step:
- Step 1: Determine the Pivot Point (P)
- Step 2: Calculate the Resistance Levels (R1, R2, R3)
- Step 3: Calculate the Support Levels (S1, S2, S3)
This is calculated by adding together the high, low, and closing prices of the previous trading session and then dividing the sum by 3. The resulting value is the pivot point.
Pivot Point (P) = (High + Low + Close) / 3
To calculate the resistance levels, you can use the pivot point and the high and low prices of the previous session:
Resistance 1 (R1) = (2 x P) – Low
Resistance 2 (R2) = P + (High – Low)
Resistance 3 (R3) = High + 2 x (P – Low)
Similarly, the support levels can be calculated using the pivot point and the high and low prices:
Support 1 (S1) = (2 x P) – High
Support 2 (S2) = P – (High – Low)
Support 3 (S3) = Low – 2 x (High – P)
These formulas enable traders to identify the key levels that may act as points of support or resistance in the current or upcoming trading session.
It is worth noting that some trading platforms provide automated tools to calculate pivot points, making the process quicker and more efficient for traders. These tools eliminate the need for manual calculations and can generate pivot points for various timeframes and trading instruments.
Pivot points can serve as invaluable reference points for traders, helping them determine potential entry and exit levels, set stop-loss and take-profit orders, and manage their risk effectively. While pivot points are commonly used in day trading, they can be applied to various trading strategies and timeframes.
In the next section, we will explore the different types of pivot points and their significance in trading.
Types of Pivot Points
While the standard pivot point calculation formula discussed earlier is the most commonly used, there are variations of pivot points that traders can utilize based on their trading strategies and preferences. These variations include Camarilla pivot points, Fibonacci pivot points, and Woodie’s pivot points.
1. Camarilla Pivot Points:
Camarilla pivot points are a variation of pivot points that were developed by Nick Scott in the 1980s. These pivot points place a greater emphasis on the previous day’s closing price. The formula for calculating Camarilla pivot points is more complex and involves using specific multipliers and ratios. Camarilla pivot points focus on potential breakout levels and can be useful for day traders looking for quick intraday price movements.
2. Fibonacci Pivot Points:
Fibonacci pivot points utilize the Fibonacci sequence and ratios to calculate potential levels of support and resistance. The Fibonacci sequence is a series of numbers where each number is the sum of the two preceding numbers (e.g., 0, 1, 1, 2, 3, 5, 8…). Traders can apply these ratios (e.g., 0.382, 0.618) to the high, low, and closing prices of a previous session to calculate Fibonacci pivot points. Fibonacci pivot points are popular among traders who believe in the significance of Fibonacci retracement levels in technical analysis.
3. Woodie’s Pivot Points:
Woodie’s pivot points are another variation that was developed by trader and author Ken Wood. Woodie’s pivot points give more weight to the current day’s opening price compared to the standard pivot point calculation. The formulas for Woodie’s pivot points are slightly different and take into account the high, low, and opening prices of the trading session. This variation is often favored by short-term traders who want to gauge the market sentiment based on the opening price.
It’s important to thoroughly understand the specific formulas and calculation methods for each type of pivot point before incorporating them into your trading strategy. Each type has its own unique characteristics and may produce different support and resistance levels.
The choice of which pivot point variation to use ultimately depends on your trading style, preferences, and the specific market conditions. Some traders may prefer the simplicity of the standard pivot points, while others may opt for the customization and specificity offered by Camarilla, Fibonacci, or Woodie’s pivot points.
In the next section, we will explore how pivot points can be effectively used in trading strategies.
How to Use Pivot Points in Trading
Pivot points serve as powerful tools for traders to make informed trading decisions based on potential levels of support and resistance. By understanding how to effectively use pivot points, traders can enhance their trading strategies and increase their chances of success. Here are some key ways pivot points can be used in trading:
1. Identifying Support and Resistance Levels: Pivot points act as reference points for support and resistance. Traders can look for price reactions around these levels, such as bounces or breakouts, to anticipate potential market movements and plan their trades accordingly.
2. Setting Entry and Exit Points: Pivot points can help traders determine optimal entry and exit points for their trades. For example, a trader may enter a long position when the price breaks above the pivot point or a resistance level, and exit the trade when the price reaches a higher resistance level.
3. Managing Stop-Loss and Take-Profit Levels: Pivot points can serve as a guide for setting stop-loss and take-profit levels. Traders may place their stop-loss orders below the support levels or pivot point to protect their capital, while take-profit levels can be set near resistance levels to lock in profits.
4. Confirming Price Reversals: When a price approaches a pivot point, it can act as a key level to confirm potential price reversals. Traders may look for candlestick patterns, chart formations, or other technical indicators to support their decision to enter or exit trades when price action confirms a reversal at a pivot point.
5. Combining with Other Indicators: Pivot points can be used in conjunction with other technical indicators to strengthen trading signals. Traders may consider using oscillators, moving averages, or trendlines to confirm pivot point signals and increase the probability of successful trades.
When using pivot points, it’s essential to consider the timeframe and trading instrument being analyzed. Pivot points can be effective on various timeframes, from intraday charts to daily or weekly charts, and can be applied to different financial markets, including stocks, forex, commodities, and indices.
As with any trading tool, pivot points are not foolproof and should be used in conjunction with proper risk management strategies. It is important to validate pivot point levels using other forms of analysis and to adapt to changing market conditions.
In the next sections, we will explore how support and resistance levels can be incorporated with pivot points to further enhance trading strategies and examine the advantages and limitations of using pivot points.
Support and Resistance Levels with Pivot Points
Pivot points are an effective tool for identifying support and resistance levels in trading. These levels can play a crucial role in determining potential entry and exit points, as well as managing risk. When combined with pivot points, support and resistance levels can provide traders with valuable insights into market dynamics and price action. Here’s how support and resistance levels work in conjunction with pivot points:
1. Support Levels:
Support levels are price levels where buying pressure is expected to outweigh selling pressure, causing the price to potentially reverse or “bounce” back up. In the context of pivot points, the support levels below the pivot point, such as S1, S2, and S3, are considered potential support zones. Traders pay attention to these levels as they may act as price floors, providing opportunities for buying or taking profits on short positions.
2. Resistance Levels:
Resistance levels are price levels where selling pressure is expected to outweigh buying pressure, prompting the price to potentially reverse or encounter selling pressure. In conjunction with pivot points, the resistance levels above the pivot point, such as R1, R2, and R3, are considered potential resistance zones. Traders monitor these levels as they may act as barriers that could result in price reversals or profit-taking on long positions.
When the price approaches a support or resistance level, traders analyze price action, volume, and other technical indicators to assess the probability of a reversal or breakout. If the price bounces off a support level, it may present a buying opportunity. Conversely, if the price breaks above a resistance level, it may offer a chance to enter a long position.
Support and resistance levels derived from pivot points serve as key decision points for traders. Depending on their trading strategy and risk tolerance, traders may choose to enter or exit positions near these levels to take advantage of potential price reactions and optimize their trading outcomes.
It’s important to note that support and resistance levels are not fixed, and they can shift as new price data becomes available. Traders should regularly update pivot points and reassess support and resistance levels to adapt to changing market conditions.
In the next section, we will delve into how pivot points can be used as entry and exit signals in trading strategies.
Pivot Points as Entry and Exit Signals
Pivot points can serve as valuable entry and exit signals for traders, helping them make well-timed trading decisions. By analyzing price action around pivot points and their associated support and resistance levels, traders can identify potential entry and exit points in the market. Here’s how pivot points can be used as entry and exit signals:
1. Pivot Point Breakouts:
When the price breaks above the pivot point or a resistance level, it can signal a potential entry point for long positions. This breakout indicates a shift in market sentiment and buying pressure. Traders can consider entering a long trade when the price successfully breaks and holds above the pivot point, aiming for higher resistance levels as profit targets. Similarly, a breakout below the pivot point or a support level can signal a potential entry point for short positions.
2. Reversals at Support and Resistance:
When the price reaches a support or resistance level derived from pivot points, it can act as a signal for potential reversals. Traders observe price action, such as bullish or bearish candlestick patterns or indicators showing overbought or oversold conditions, to confirm the reversal signal. For example, if the price reaches a support level, shows signs of bullish reversal, and confirms the pivot point level is holding as support, it may present an entry signal for long positions. Conversely, if the price approaches a resistance level, demonstrates bearish reversal patterns, and confirms the pivot point level acting as resistance, it may signal an entry point for short positions.
3. Profit-Taking at Resistance Levels:
As the price approaches resistance levels derived from pivot points, traders may consider taking profits on long positions. These levels often act as barriers for further upward movement, and the price may encounter selling pressure, resulting in a potential pullback or reversal. By booking profits near these resistance levels, traders secure their gains and protect against potential price reversals.
4. Stop-Loss Placement:
Traders can use pivot points to determine optimal stop-loss levels to manage their risk. Placing stop-loss orders below the support levels or pivot points for long positions and above the resistance levels or pivot points for short positions can help protect against significant losses if the price moves against the anticipated direction.
It’s important to note that using pivot points as entry and exit signals should be combined with other technical analysis tools, such as trendlines, indicators, and volume analysis, to enhance the robustness of trading decisions. Traders should also consider the overall market conditions, news events, and risk management principles to ensure a well-rounded trading approach.
In the next section, we will explore the advantages of using pivot points in trading strategies.
Advantages of Using Pivot Points
Using pivot points in trading strategies offers several advantages that can aid traders in making informed decisions and improving their trading outcomes. Here are some key advantages of incorporating pivot points into your trading approach:
1. Objective Price Reference:
Pivot points provide objective reference levels derived from previous price data. They offer a clear and quantifiable framework for identifying potential support and resistance levels, allowing traders to make more objective trading decisions based on concrete price levels rather than subjective interpretations.
2. Quick Assessment of Market Sentiment:
Pivot points offer a snapshot of market sentiment by indicating potential levels of buying or selling pressure. By observing how the price reacts around pivot points and their associated support and resistance levels, traders can gauge the prevailing sentiment and make timely trading decisions accordingly.
3. Identifying Key Price Levels:
Pivot points highlight key price levels where significant buying or selling activity may occur. Traders can use these levels to identify potential entry and exit points, set stop-loss and take-profit orders, and manage their positions effectively. These key price levels can act as price targets or decision points for traders, increasing the accuracy of their trading strategies.
4. Applicable to Various Timeframes:
One of the advantages of pivot points is their versatility across different timeframes. While commonly used on daily charts, pivot points can also be applied to shorter timeframes such as hourly or 15-minute charts for intraday trading. This flexibility allows traders to adjust their strategies to suit their preferred trading style and time horizon.
5. Compatible with Multiple Trading Instruments:
Pivot points can be used across various financial markets and trading instruments, including stocks, forex, commodities, and indices. Traders can apply the same principles and techniques to different markets, allowing for consistent analysis and decision-making regardless of the asset being traded.
6. Integration with Other Technical Analysis Tools:
Pivot points can be effectively combined with other technical indicators, such as moving averages, trendlines, and oscillators, to reinforce trading signals. This integration enhances the overall robustness of a trading strategy, providing traders with additional confirmation and greater confidence in their trading decisions.
7. Widely Used and Recognized:
Pivot points are widely known and used by traders around the world. This means that many market participants, including institutional traders, may also be observing and basing their trading decisions on pivot points. This widespread recognition can contribute to the reliability and effectiveness of pivot points as technical analysis tools.
By leveraging these advantages, traders can improve their trading strategies and decision-making processes. However, it is crucial to note that pivot points should not be used in isolation, and it is always recommended to incorporate proper risk management techniques and additional analysis to validate trading signals.
In the next section, we will discuss the limitations and considerations when using pivot points in trading.
Limitations of Pivot Points
While pivot points can be a valuable tool in trading, it is important to be aware of their limitations and consider them when incorporating pivot points into your trading strategy. Here are some limitations to keep in mind:
1. Reliance on Historical Data:
Pivot points are based on historical price data, specifically the previous day’s high, low, and closing prices. This reliance on past data means that pivot points may not always accurately reflect current market conditions or anticipate sudden market shifts caused by unexpected news events or market sentiment changes.
2. Lack of Context and Trend Consideration:
Pivot points primarily focus on price levels and potential areas of support and resistance. While this can be useful in identifying short-term reversals or price reactions, it may not take into account the broader market trend or larger market forces. It is important to consider the overall market context and trends when using pivot points for trading decisions.
3. Subjectivity in Interpretation:
While pivot points provide objective price levels, the interpretation of price action around these levels can still be subjective. Traders may have different criteria for determining entry and exit signals based on their individual strategies, risk appetite, and reliance on additional technical indicators.
4. Inadequate for Trending Markets:
Pivot points are most effective in sideways or range-bound markets where price exhibits regular oscillation. In strongly trending markets, pivot points may provide less reliable signals as the price tends to break through support and resistance levels without significant pullbacks, making it challenging to determine clear entry and exit points.
5. Standard Formula Limitations:
The standard pivot point calculation formula treats all price data equally, without giving more weight to recent data or considering other factors that may impact market dynamics. Traders who prefer to incorporate more dynamic or customized calculations may find the standard calculation limitations in meeting their specific needs.
6. Limitations in Shorter Timeframes:
Pivot points are commonly used on daily charts; however, their effectiveness may diminish on shorter timeframes due to increased market noise and erratic price behavior. Traders should exercise caution when applying pivot points to shorter timeframes, as the increased volatility can lead to false signals and reduced reliability.
While being aware of these limitations, traders can mitigate their impact by incorporating pivot points with other technical indicators, utilizing proper risk management techniques, and adjusting their strategies based on changing market conditions.
In the next section, we will conclude the article and summarize the key points discussed about pivot points in trading.
Conclusion
Pivot points are a powerful tool in a trader’s arsenal, providing valuable insights into potential levels of support and resistance. By calculating pivot points based on previous price data, traders can identify key levels that may influence price movements and make more informed trading decisions.
Throughout this article, we explored the concept of pivot points, their calculation process, and the different types available. We discussed how pivot points can be effectively used as entry and exit signals in trading, as well as their advantages and limitations.
Advantages of using pivot points include their objective price reference, ability to assess market sentiment, identification of key price levels, compatibility with various timeframes and trading instruments, integration with other technical analysis tools, and widespread recognition among traders.
However, it is essential to acknowledge the limitations of pivot points, such as their reliance on historical data, potential lack of context and trend consideration, subjectivity in interpretation, challenges in trending markets, limitations of the standard formula, and reduced effectiveness on shorter timeframes.
To overcome these limitations, traders should complement pivot points with other technical indicators, consider market context and trends, exercise proper risk management, and adapt their strategies to fit current market conditions.
Incorporating pivot points into your trading strategy requires practice, experience, and continuous evaluation. It is important to test and refine your approach, adapting it to your individual trading style and preferences.
Remember, pivot points are just one tool among many in a trader’s toolkit. Utilize them in conjunction with comprehensive market analysis, risk management techniques, and proper money management to build a robust trading strategy.
We hope this article has provided you with a comprehensive understanding of pivot points and their application in trading. By incorporating pivot points into your analysis, you can enhance your ability to identify potential entry and exit points, manage your risk effectively, and make more confident trading decisions in the dynamic world of financial markets.