Introduction
When it comes to trading, understanding specific concepts and terminologies is crucial for success. One such concept that traders need to grasp is ticks. Ticks play a vital role in the financial markets and are instrumental in analyzing price movements and making informed trading decisions.
So, what exactly are ticks in trading? In simple terms, a tick represents the smallest possible price movement in a financial instrument. It is a measure of upward or downward movement in the price of an asset, be it stocks, futures, currencies, or commodities.
Ticks are commonly used in various types of trading, such as day trading, scalping, and high-frequency trading, where traders rely on accurate and timely price information. Understanding how ticks are measured and their importance in trading is essential for any market participant.
In this article, we will delve into the world of ticks in trading, exploring how they are measured, why they are important, and the differences between ticks and pips. We will also discuss the use of tick charts versus time-based charts and the distinction between tick volume and regular volume. Additionally, we will touch upon common tick sizes in different instruments and share some tips for effectively trading with tick charts.
By the end of this article, you will have a clear understanding of ticks and their significance in trading, equipping you with valuable knowledge to enhance your trading strategies and decision-making.
What Are Ticks?
In trading, ticks are the smallest unit of measurement used to track price changes in financial instruments. A tick represents a single movement in the price of an asset, either up or down. Every time the price changes, it is said to have moved by a certain number of ticks.
For example, let’s say you are observing the price of a stock, and it moves from $50.00 to $50.01. This movement represents a single tick. Similarly, if the price drops from $50.00 to $49.99, it also indicates a single tick.
The concept of ticks is not limited to stocks alone; it applies to other securities as well, including futures contracts, currencies, and commodities. In these markets, ticks serve as a standardized method to measure price variations and provide traders with precise information on market fluctuations.
The value of a tick varies depending on the specific financial instrument. For example, in the stock market, a tick may be as small as one cent, while in the futures market, it can represent a larger monetary value, such as $1 or more.
Ticks are essential for traders as they enable the measurement of price movements and the calculation of profits and losses. By keeping track of ticks, traders can identify trends, make informed trading decisions, and execute trades at the most advantageous prices.
It’s important to note that ticks are not the same as pips, although the terms are sometimes used interchangeably. While ticks represent the actual price movements, pips, on the other hand, are the percentage movements in the forex market. The value of a pip is determined by the lot size and the currency pair being traded.
In summary, ticks are the smallest increments by which the price of a financial instrument can change. They are used to track price movements and provide traders with crucial information about market dynamics. Understanding ticks is essential for accurately analyzing price data and effectively executing trading strategies.
How Are Ticks Measured in Trading?
In trading, ticks are quantified based on the minimum price movement allowed in a particular financial instrument. Each instrument has a specific tick size, which denotes the minimum price increment by which its value can change.
For example, in the stock market, the tick size is typically one cent. Therefore, if a stock has a tick size of one cent and it moves from $10.00 to $10.01, it represents a single tick. Similarly, if it drops from $10.01 to $10.00, it also counts as one tick.
The tick size for futures contracts varies depending on the contract specification. It could be a few cents for commodities or even several dollars for certain financial futures. For instance, if the tick size for an e-mini S&P 500 futures contract is $0.25, a move from 3000.00 to 3000.25 represents one tick.
Forex markets measure ticks in the form of pips for currency pairs. A pip, or percentage in point, is the smallest unit of change in a currency pair’s exchange rate. While the value of a pip is determined by the lot size and the currency pair, most forex pairs are quoted with a fourth decimal place, representing a pip-sized movement.
Some trading platforms and charting software allow traders to customize the tick size based on their preference. This flexibility is particularly useful for traders who focus on specific instruments and want to analyze price movements more precisely.
It’s important to note that tick measurement is not limited to price movement alone. It can also refer to the number of trades executed within a given timeframe. Tick data, also known as tick-by-tick data, provides information about each individual trade made in the market, including the time, price, and volume. This level of granularity can be valuable for traders who employ tick-based strategies or use tick volume as part of their analysis.
In summary, ticks are measured based on the minimum price movement allowed in a particular financial instrument. Each instrument has a specific tick size that determines how ticks are quantified. Understanding tick measurement is crucial for accurately analyzing price changes and making informed trading decisions.
Why Are Ticks Important in Trading?
Ticks play a critical role in trading and are essential for several reasons. Understanding their importance allows traders to effectively analyze price movements, identify trends, and make informed trading decisions. Here are some key reasons why ticks are important in trading:
- Price analysis: Ticks provide traders with precise information about price movements. By analyzing ticks, traders can identify patterns, trends, and support/resistance levels, enabling them to anticipate future price movements and make more accurate predictions.
- Trade execution: Ticks allow traders to determine the optimal entry and exit points for their trades. By closely monitoring ticks, traders can identify potential entry signals or confirm existing ones, ensuring that trades are executed at the most advantageous prices.
- Risk management: Tick data is invaluable for effective risk management. By analyzing ticks, traders can set appropriate stop-loss levels and determine the potential risk/reward ratio for each trade. This enables them to manage their risk exposure and protect their trading capital.
- Volatility assessment: Ticks provide insights into market volatility. By observing the frequency and size of price movements, traders can gauge the level of market volatility. This information helps them adjust their trading strategies accordingly, ensuring that they are prepared for different market conditions.
- Trading strategies: Ticks are essential for implementing various trading strategies, such as scalping, day trading, and high-frequency trading. Traders who rely on short-term price movements and quick trades often use tick charts and tick-based indicators to identify trading opportunities and execute trades with precision.
- Market depth analysis: Tick data includes information about the volume of trades executed at each price level. This data, known as tick volume, provides insights into market liquidity and the strength of price movements. Traders can use tick volume analysis to confirm breakouts, assess market participation, and identify potential reversals.
- Algorithmic trading: Ticks are crucial for algorithmic trading systems that operate on high-frequency trading strategies. These systems rely on tick data to identify and execute trades swiftly, taking advantage of small price movements to generate profits.
In summary, ticks are important in trading due to their role in price analysis, trade execution, risk management, volatility assessment, trading strategies, market depth analysis, and algorithmic trading. By understanding and utilizing tick data effectively, traders can enhance their decision-making process and improve the overall success of their trades.
The Difference Between Ticks and Pips
While ticks and pips are both terms used in trading to measure price movements, they are distinct concepts with different applications. Understanding the difference between ticks and pips is crucial for accurate analysis and effective trading strategies. Here are the key differences:
Ticks:
Ticks measure the smallest possible price movement in a financial instrument. They represent the actual price change, either positive or negative, and are used to track price movements across various markets, including stocks, futures, and commodities. The tick size varies depending on the instrument, and traders analyze tick data to identify trends, make trading decisions, and calculate profits and losses.
Pips:
Pips, short for “percentage in point,” are used to measure price movements in the forex market. Unlike ticks, pips do not directly represent the price change but rather the percentage change in the exchange rate of a currency pair. The value of a pip is determined by the lot size and the currency pair being traded. Pips are primarily used in the forex market to calculate profits and losses, determine the risk/reward ratio, and set stop-loss and take-profit levels.
The main difference between ticks and pips lies in their scope and application. Ticks are used to measure price movements across various financial instruments, whereas pips are specific to the forex market. Ticks directly represent the actual price change, whereas pips represent the percentage change in the exchange rate.
Additionally, the way ticks and pips are displayed on trading platforms also differs. Ticks are often shown as a series of price movements, with each tick representing a different price level. On the other hand, pips are represented as a numerical value or a decimal point movement in the exchange rate.
It’s important for traders to understand these distinctions to accurately interpret and analyze price data. Whether you are trading stocks, futures, or forex, being aware of the measurement units used for price movements will enable you to make more informed trading decisions based on the specific characteristics of each market.
In summary, ticks and pips are measurements used in trading to track price movements. Ticks measure the smallest price increment in various financial instruments, while pips represent the percentage change in the forex market’s exchange rate. Understanding the difference between ticks and pips enhances traders’ ability to analyze price data and execute effective trading strategies in different markets.
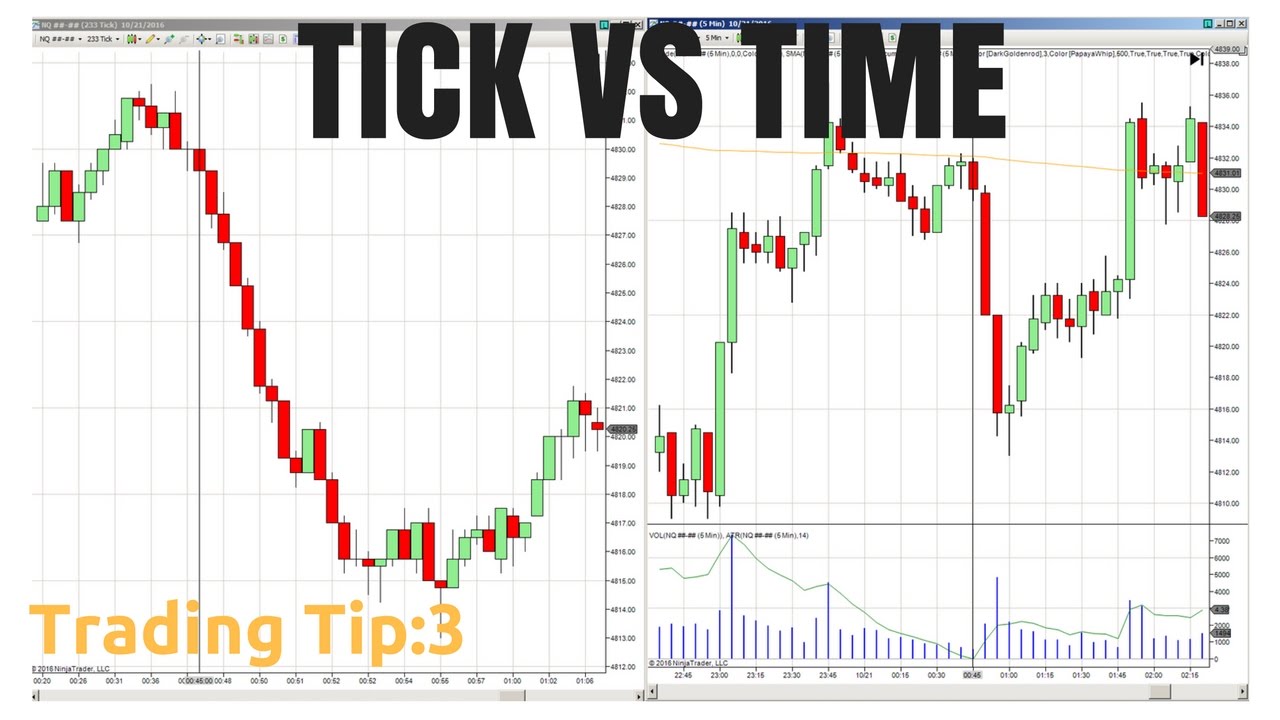
Tick Charts vs Time-Based Charts
When it comes to analyzing price movements, traders have the option to use either tick charts or time-based charts. Each chart type has its advantages and considerations, and understanding the differences between them is crucial for making informed trading decisions. Here are the key distinctions between tick charts and time-based charts:
Tick Charts:
Tick charts measure price movements based on the number of trades executed, rather than the time elapsed. In a tick chart, each bar or candlestick represents a specific number of trades, such as 100, 500, or 1,000 trades, depending on the trader’s preference. This means that the width of the bars on a tick chart can vary, depending on the trading activity and level of volatility in the market.
The primary advantage of tick charts is that they provide a more accurate representation of market activity, especially during periods of high volatility or low trading volume. Tick charts are particularly beneficial for traders who utilize scalping or short-term trading strategies, as they offer a clearer visualization of rapid price movements and allow traders to effectively capture quick opportunities.
However, it’s important to note that tick charts can vary from one trading platform to another, as they depend on the data feed and the frequency of updates. Additionally, tick charts can be influenced by market noise and irregular trading activity, leading to potential false signals.
Time-Based Charts:
Time-based charts, such as daily, hourly, or minute charts, measure price movements based on the time elapsed. In these charts, each bar or candlestick represents a specific time period, such as one day, one hour, or one minute. The width of the bars remains constant on a time-based chart, regardless of the trading activity or market volatility.
The advantage of time-based charts is their consistency and stability, providing traders with a clear view of price trends and patterns over specific timeframes. Time-based charts are often favored by swing traders or longer-term investors who rely on identifying larger market trends and making more calculated trading decisions.
However, time-based charts may not capture rapid price movements or spikes in volatility as effectively as tick charts. Traders who rely heavily on precise timing and quick decision-making may find that time-based charts do not provide the same level of granularity and responsiveness as tick charts.
Ultimately, the choice between tick charts and time-based charts depends on the trader’s trading style, preferences, and the specific market being traded. Some traders may choose to use a combination of both chart types to gain different perspectives on price movements and enhance their analytical capabilities.
In summary, tick charts and time-based charts offer different approaches to analyzing price movements in trading. Tick charts focus on trade activity, providing a more accurate representation of market dynamics and better suiting short-term trading strategies. Time-based charts, on the other hand, provide a consistent and stable view of price trends over specific timeframes, catering to swing traders and longer-term investors.
Tick Volume vs Regular Volume
In trading, volume provides valuable insight into market activity and liquidity. It is a measure of the number of shares, contracts, or units traded within a specific period. While regular volume is widely used to analyze market participation and price movements, tick volume offers a slightly different perspective. Let’s explore the differences between tick volume and regular volume:
Regular Volume:
Regular volume, also known as typical volume, is based on the number of contracts or shares traded within a given time frame, such as one minute, one hour, or one day. It measures the actual quantity of trades executed in the market during that time period. Regular volume bars are typically uniform in width and displayed on volume-based charts.
Regular volume is used to assess market participation and liquidity. High volume indicates strong market interest and higher activity levels, while low volume suggests diminished interest and potentially thin trading conditions. Traders often analyze regular volume in conjunction with price movements to identify trends, confirm breakouts, or spot divergences.
Tick Volume:
Tick volume, also known as tick count or volume by price, focuses on the number of price changes (ticks) that occur within a specified period. Instead of measuring the volume in terms of contracts or shares traded, tick volume quantifies the number of price movements regardless of the trading quantity involved.
The primary advantage of tick volume is its ability to filter out trades involving smaller quantities or insignificant price movements. It provides a more accurate representation of market activity and highlights periods of high trading intensity and volatility. Tick volume is often utilized in combination with tick charts, wherein each bar or candlestick represents a specific number of ticks.
It’s important to note that tick volume may not always directly correlate to regular volume. This discrepancy arises because tick volume counts every price change, even if it involves a single share or contract. Therefore, tick volume can be more volatile and sensitive to rapid price movements compared to regular volume.
Both regular volume and tick volume have their merits, and traders choose the one that best aligns with their trading strategies and preferences. Regular volume provides a broader view of market participation and trends, while tick volume offers more granular insights into trading activity and price volatility.
In summary, regular volume and tick volume provide different perspectives on market activity. Regular volume measures the actual quantity of shares or contracts traded within a specific time frame, while tick volume focuses on the number of price changes or ticks. Both volume measures have their uses in trading, allowing traders to gauge market interest, liquidity, and price movements.
Common Tick Sizes in Different Instruments
In trading, tick size refers to the minimum price increment by which the value of a financial instrument can change. Understanding the tick size is essential for accurately interpreting price movements and determining the potential profit or loss on a trade. Here are some common tick sizes in different types of instruments:
Stocks:
In the stock market, tick sizes can vary widely. For stocks listed on major exchanges, the tick size is typically one cent. This means that the minimum price movement a stock can make is one cent. However, stocks that trade at higher prices may have wider tick sizes, such as five cents, ten cents, or even larger increments.
Futures Contracts:
Futures contracts have predetermined tick sizes, which are determined by the exchange on which they trade. For example, in the E-mini S&P 500 futures contract, the tick size is 0.25 index points, representing a value of $12.50 per tick. In the Crude Oil futures contract, the tick size is 0.01, equivalent to $10 per tick. The tick size can vary depending on the specific futures contract and the underlying asset being traded.
Currencies:
In the forex market, tick sizes are referred to as pips. The pip size depends on the currency pair being traded and the lot size of the trade. For most major currency pairs, a pip is typically equal to 0.0001, except for the Japanese Yen pairs, where a pip is 0.01. So, if you are trading the EUR/USD currency pair, a one-pip movement would be 0.0001 in value.
Commodities:
Tick sizes for commodities can vary significantly depending on the specific commodity being traded. For example, in gold futures, the tick size is 0.10, equaling $10 per tick. Natural gas futures have a tick size of 0.001, which represents $10 per tick. Each commodity contract will have its own tick size specification that traders need to be aware of.
It’s important to note that tick sizes are subject to change. Exchanges occasionally adjust tick sizes to accommodate changes in market conditions or to improve price efficiency. Traders should stay updated with any announcements or changes made by the relevant exchanges.
Understanding the tick sizes in different instruments is crucial for properly analyzing price movements and managing risk. By being aware of the tick size, traders can accurately calculate profits and losses, set stop-loss and take-profit levels, and make informed trading decisions.
In summary, tick sizes vary across different types of instruments. Stocks generally have tick sizes of one cent, while futures contracts and currencies have specific tick size specifications determined by the exchange or market. Commodities also have varying tick sizes depending on the specific commodity being traded. Traders need to be aware of the tick size for each instrument they trade to interpret price movements accurately and make informed trading choices.
Tips for Trading with Tick Charts
Trading with tick charts can provide valuable insights into price movements and help traders make informed decisions. Here are some tips to consider when using tick charts in your trading:
- Choose an appropriate tick size: Select a tick size that aligns with your trading strategy and the specific instrument you are trading. A smaller tick size allows for more granular price analysis, while a larger tick size provides a broader view of the market.
- Combine tick charts with other tools: Consider using tick charts in conjunction with other technical indicators and charting tools. Combining tick-based analysis with traditional indicators can provide a comprehensive view of market dynamics and confirm potential trading signals.
- Adjust tick chart interval: Depending on market conditions and the instrument being traded, adjust the tick chart interval to capture the desired level of detail. Shorter tick intervals are suitable for high-frequency trading or scalping, while longer intervals may be more appropriate for swing or position trading.
- Understand tick volume: Analyze tick volume to gauge market liquidity and participation. Higher tick volume indicates greater market interest and can help confirm the strength of price movements.
- Consider tick-based price patterns: Pay attention to specific price patterns that occur on tick charts. Price patterns such as breakouts, reversals, trends, and support/resistance levels can be effectively identified and analyzed on tick-based charts.
- Manage risk effectively: Set your stop-loss and take-profit levels based on the price levels identified on the tick charts. Use tick data to determine appropriate levels for risk management and ensure that your trading strategy is aligned with the market conditions.
- Monitor tick chart momentum: Observe the momentum in tick charts to assess the strength or weakness of price movements. Rapid and sustained tick movements in one direction can indicate strong momentum, and traders can capitalize on this information to make timely trading decisions.
- Practice and familiarize yourself: Spend time practicing with tick charts in a demo or simulated trading environment. Familiarize yourself with how tick charts display price movements and experiment with different tick sizes and intervals to find what works best for your trading style and preferences.
- Stay flexible: Be adaptable and willing to adjust your tick chart settings as market conditions change. Different instruments and trading sessions may require modifications to your tick-based analysis tools to remain effective.
Remember that using tick charts, like any other trading method, requires practice, experience, and a deep understanding of market dynamics. Incorporate these tips into your trading routine and develop a strategy that complements your trading style and goals.
In summary, trading with tick charts can offer valuable insights into price movements and help traders make more informed trading decisions. By selecting appropriate tick sizes, combining tick charts with other tools, and effectively managing risk, traders can utilize the benefits of tick-based analysis to enhance their trading strategies and achieve better trading outcomes.
Conclusion
Ticks are a fundamental concept in trading, representing the smallest price movement in a financial instrument. They play a crucial role in analyzing price movements, executing trades, and making informed trading decisions. By understanding how ticks are measured and their significance in different markets, traders can enhance their ability to interpret price data and develop effective trading strategies.
In this article, we explored the definition of ticks and their measurement in various trading instruments. We learned about the differences between ticks and pips, where ticks represent price movements and pips denote percentage changes in currency pairs. We also discussed the advantages and considerations of tick charts versus time-based charts, each providing unique perspectives on price movements.
Furthermore, we examined tick volume versus regular volume, understanding how tick volume captures trading activity and market liquidity. We explored common tick sizes in different instruments, emphasizing the importance of knowing the specific tick size for accurate analysis.
Finally, we provided tips for trading with tick charts, including the selection of an appropriate tick size, the combination of tick charts with other analytical tools, and the effective management of risk. We encouraged traders to practice and familiarize themselves with tick charts while staying flexible and adaptable to changing market conditions.
In summary, ticks are a vital component of trading, enabling traders to analyze price movements and make informed decisions. Incorporating tick-based analysis into your trading strategy can enhance your understanding of market dynamics and help achieve more consistent trading results. By continually learning and refining your skills, you can effectively leverage ticks to improve your trading performance in the financial markets.

![The Best Pokemon Fire Red Cheat Codes [100% Working]](https://robots.net/wp-content/uploads/2020/05/Pokemon-Fire-Red-300x201.jpg)