Introduction
Trading View is a powerful and user-friendly platform that allows traders and investors to analyze financial markets, track trends, and make informed trading decisions. Whether you are a beginner or an experienced trader, Trading View provides a wide range of tools and features to enhance your trading experience.
With Trading View, you can access a vast array of markets, including stocks, cryptocurrencies, forex, and commodities. The platform combines real-time data, advanced charting capabilities, technical indicators, and a thriving community of traders to create a comprehensive trading ecosystem.
Creating an account on Trading View is quick and easy. Once you sign up, you gain access to a world of trading opportunities and can tailor the platform to suit your individual needs. Whether you’re a day trader, swing trader, or long-term investor, Trading View has the tools you need to analyze, plan, and execute your trades.
In this guide, we will walk you through the various features and functionalities of Trading View, helping you navigate the interface, customize your charts, and utilize technical indicators to make well-informed trading decisions. We will also explore how to save and load charts, draw on charts using various tools and annotations, and leverage Trading View’s social and community features to collaborate with other traders.
Additionally, we will delve into advanced features and explore the different versions of Trading View, such as the Pro editions, which offer enhanced capabilities and additional benefits for serious traders. By the end of this guide, you will be equipped with the knowledge to make the most of Trading View and optimize your trading strategy.
So, whether you’re a novice trader looking to learn the basics or an experienced investor seeking a robust platform to analyze the markets, Trading View is your go-to solution. Let’s dive in and discover the endless possibilities that Trading View has to offer.
Creating an Account
Getting started with Trading View is a breeze. To create an account, simply visit the Trading View website and click on the “Sign Up” button. You will be prompted to provide your email address, create a secure password, and agree to the terms and conditions.
Once you have filled in the necessary information, click on the verification link that will be sent to your email. This ensures the security of your account and helps prevent unauthorized access.
After verifying your email, you can proceed to customize your Trading View experience. You will have the option to choose your preferred language, time zone, and theme for the platform. These personalization features allow you to tailor Trading View to your specific trading needs and preferences.
Furthermore, you can enhance your Trading View account by connecting it to your brokerage account. Trading View supports integration with numerous popular brokers, including eToro, Interactive Brokers, and many more. This integration allows you to execute trades directly from the Trading View platform, streamlining your trading process.
Trading View offers both free and paid subscription plans. The free plan provides access to a wide range of features, including real-time data, multiple chart layouts, and a selection of technical indicators. However, if you require more advanced functionalities and additional benefits, you may consider upgrading to one of the paid subscription plans.
The paid subscription plans, such as the Pro, Pro+, and Premium plans, offer advanced features like extended trading hours, more powerful indicators, and enhanced customer support. These plans cater to the needs of professional traders and serious investors who require comprehensive tools and real-time market insights.
With your Trading View account set up, you are now ready to explore the various features and functionalities of the platform. In the next section, we will guide you through the Trading View interface and help you navigate smoothly to make the most of this powerful trading tool.
Navigating the Trading View Interface
Once you have created your Trading View account, you will be greeted with a sleek and intuitive interface. Familiarizing yourself with the various components of the interface will help you navigate the platform with ease and efficiency.
At the top of the screen, you will find the main navigation bar. Here, you can access different sections of Trading View, such as Charts, Screener, and Ideas. You can also explore the community-driven features, like the social network and chat rooms, to interact with other traders and gain insights.
In the Charts section, you have the option to choose from a wide variety of markets, including stocks, forex, cryptocurrencies, and more. Simply select your desired market and you will be presented with a chart displaying real-time price data.
The left side of the screen houses the symbol search panel. Here, you can enter the name or ticker symbol of the asset you want to analyze. Trading View will provide you with a list of available options, allowing you to select the desired asset and load it onto the chart.
Once you have selected your asset, the main chart area will display the price action of the asset over a specific time period. You can customize the timeframe by selecting pre-defined intervals, such as 1-day, 1-week, or 1-month, or you can set a custom timeframe according to your trading strategy.
Below the main chart area, you will find the trading panel. This panel allows you to place trades directly from the interface if your account is connected to a compatible brokerage. You can enter the specific details of your trade, such as the quantity, order type, and duration.
On the right side of the screen, you will find the sidebar. This sidebar contains various tools and features to enhance your trading analysis. You can add technical indicators, draw trend lines, apply different chart overlays, and even view financial news related to the selected asset.
Additionally, you can customize the appearance of the chart according to your preferences. Trading View provides a range of options for chart style, color schemes, and background themes. This allows you to create a visually pleasing and personalized trading environment.
By understanding and familiarizing yourself with the different components of the Trading View interface, you will be able to navigate seamlessly and make the most of the platform’s powerful features. In the next section, we will explore how to set up your chart and customize it to suit your technical analysis needs.
Setting Up Your Chart
Setting up your chart on Trading View is crucial for conducting technical analysis and making informed trading decisions. By customizing your chart, you can display the necessary data, indicators, and tools that align with your trading strategy.
To begin, select the desired asset from the symbol search panel on the left side of the screen. Once the asset is loaded onto the chart, you can adjust the timeframe to match your trading preferences. Whether you are a day trader, swing trader, or long-term investor, Trading View offers a range of predefined intervals or the option to set a custom timeframe.
Next, consider the type of chart you want to use. Trading View provides various chart styles, including candlestick, line, bar, and area charts. Each chart style has its own advantages, so choose the one that best suits your analysis needs. Candlestick charts are most commonly used for technical analysis, as they provide valuable information on price movements and patterns.
Once you have chosen your desired chart style, you can further customize the appearance of the chart. Trading View allows you to select different color schemes, adjust the opacity of overlays, and even change the background theme. Experiment with different settings until you find the visual configuration that is most comfortable and visually appealing to you.
In addition to the visual customization, you can also add and remove technical indicators to your chart. Trading View offers a wide array of indicators, including moving averages, oscillators, and trend-following tools. These indicators can help you identify trends, gauge market momentum, and generate trading signals.
By clicking on the “Indicators” button on the top toolbar, you can access the extensive library of indicators available on Trading View. Simply search for the desired indicator, select it, and adjust the settings according to your preferences. You can add multiple indicators to your chart and customize their appearance to suit your needs.
Moreover, Trading View allows you to apply chart overlays, such as support and resistance levels, trend lines, and Fibonacci retracement levels. These tools help you identify key price levels and potential areas of support and resistance, assisting in making more accurate trading decisions.
Once you have set up your chart with the desired asset, timeframe, chart style, indicators, and overlays, you can save your chart layout for future use. This allows you to quickly load your preferred chart setup without having to set it up from scratch each time you visit Trading View.
Setting up your chart on Trading View is a crucial step in performing technical analysis. By customizing the appearance, adding indicators, and utilizing chart overlays, you can create a personalized and effective trading environment. In the next section, we will delve deeper into customizing your chart and exploring advanced features offered by Trading View.
Customizing Your Chart
Customizing your chart on Trading View allows you to personalize the visual appearance and optimize the technical analysis tools according to your trading preferences. By tailoring the chart to your needs, you can gain deeper insights into the market and make more informed trading decisions.
Trading View offers a variety of customization options, starting with the ability to choose different chart styles. Whether you prefer candlestick, line, bar, or area charts, selecting the chart style that resonates with your analysis style is essential.
In addition to the chart style, you can modify other visual elements of the chart. Trading View provides a range of color schemes and background themes, allowing you to create a visually pleasing and comfortable trading environment. Experiment with different options to find the color scheme that enhances your chart reading experience.
Another customization feature on Trading View is the ability to add multiple technical indicators to your chart. By clicking on the “Indicators” button on the top toolbar, you can access a vast library of indicators to suit your analysis needs. Whether you prefer moving averages, oscillators, or volume-based indicators, Trading View has you covered.
Furthermore, you can adjust the settings of each indicator to fine-tune its appearance and functionality. This allows you to customize the indicator to match your trading strategy and preferences. You can experiment with different parameters and visual settings to optimize your analysis.
Trading View also provides the option to apply different chart overlays. These overlays include trend lines, support and resistance levels, Fibonacci retracement levels, and more. By utilizing these overlays, you can identify key price levels, patterns, and potential entry or exit points.
In addition to indicators and overlays, Trading View offers interactive drawing tools that allow you to annotate your chart. These tools include text, arrows, shapes, and lines, which can be used to highlight important areas or make notes on specific price movements. This feature helps you keep track of your analysis and adds a visual layer of information to your chart.
To streamline your analysis process, Trading View allows you to save your customized chart layout. By saving your preferred settings, including the chart style, indicators, overlays, and drawing tools, you can quickly load your preferred setup whenever you return to Trading View.
Customizing your chart on Trading View is an important step in tailoring the platform to your trading needs. By selecting the appropriate chart style, adjusting visual elements, adding indicators and overlays, and utilizing drawing tools, you can create a powerful and personalized trading environment. In the next section, we will explore how to leverage technical indicators to enhance your analysis on Trading View.
Using Technical Indicators
Technical indicators are powerful tools that can help traders analyze price action, identify trends, and make informed trading decisions. Trading View offers a wide range of technical indicators, making it a valuable platform for technical analysis.
When using technical indicators on Trading View, it’s important to consider the specific indicator’s purpose and how it aligns with your trading strategy. Whether you’re a trend follower, momentum trader, or looking for volatility signals, Trading View has an extensive library of indicators to choose from.
To add an indicator to your chart, click on the “Indicators” button on the top toolbar. A menu will appear, providing you with a variety of categories and subcategories of indicators. You can browse through these categories or use the search function to find a specific indicator.
Once you have selected an indicator, it will appear on your chart with default settings. You can customize the indicator’s parameters by clicking on the gear icon next to it. This will allow you to fine-tune the indicator to suit your specific analysis needs.
Trading View also offers the option to add multiple indicators to a single chart. This allows you to combine different indicators and create a comprehensive analysis setup. By experimenting with different combinations, you can develop a unique trading strategy that aligns with your preferences.
Additionally, Trading View provides advanced options for each technical indicator. These options include visual settings, such as line colors, styles, and thickness, as well as parameters that affect the calculation of the indicator. By adjusting these options, you can further customize the appearance and behavior of the indicator.
It’s worth noting that Trading View not only provides popular and widely-used indicators but also offers community-developed custom indicators. These custom indicators can be found in the public library and can be a valuable addition to your analysis toolkit.
When using technical indicators, it’s important to consider their strengths and limitations. No indicator is foolproof, and it’s essential to combine technical analysis with other forms of analysis, such as fundamental analysis and market sentiment, for a well-rounded trading strategy.
As you gain experience in using technical indicators, you can also explore more advanced techniques, such as creating custom indicators or developing trading strategies using Trading View’s Pine Script programming language. These advanced features can help you take your analysis to the next level.
By utilizing the wide range of technical indicators available on Trading View and customizing them to your trading strategy, you can enhance your analysis and make more informed trading decisions. In the next section, we will explore how to save and load charts on Trading View.
Saving and Loading Charts
Saving and loading charts is a convenient and time-saving feature offered by Trading View. By saving your preferred chart layout, including indicators, overlays, and drawing tools, you can quickly access and analyze your custom setup whenever you return to the platform.
To save your chart layout, click on the “Layouts” button located on the top toolbar. A dropdown menu will appear, offering options for saving, loading, and managing your saved layouts. Click on “Save Current Layout” to save the current configuration of your chart.
When saving your layout, you will be prompted to give it a name. Choose a descriptive name that will help you easily identify the specific chart layout in the future. Once you have entered a name, click “Save,” and your chart layout will be saved for future use.
To load a saved chart layout, click on the “Layouts” button again and select the “Load Layout” option from the dropdown menu. A list of your saved layouts will appear, allowing you to select the desired chart layout to load onto your current chart.
In addition to saving and loading chart layouts, Trading View also offers the option to save and load specific chart templates. A chart template includes indicators, overlays, and drawing tools, without the need to save the entire chart layout.
To save a chart template, right-click on the chart and select “Save as Template” from the context menu. Similar to saving a chart layout, you will be prompted to give the template a name. Once saved, the template can be accessed and applied to any chart on Trading View.
To load a chart template, right-click on the chart and select “Load Template.” A list of your saved templates will appear, allowing you to choose the desired template to apply to your current chart.
By utilizing the saving and loading features on Trading View, you can efficiently manage and switch between different chart layouts and templates. This eliminates the need to manually set up your chart each time you visit the platform, saving you time and ensuring consistency in your analysis.
Whether you want to switch between different trading strategies, compare different assets, or analyze different timeframes, the ability to save and load charts and templates makes it effortless and seamless.
Take advantage of this time-saving feature offered by Trading View and simplify your trading workflow. In the next section, we will delve into analyzing chart patterns, a fundamental aspect of technical analysis.
Analyzing Chart Patterns
Chart patterns are visual representations of price movements on a trading chart. They provide valuable insights into market trends and can help traders identify potential opportunities. Trading View offers a wide range of chart patterns that can be analyzed and utilized in your trading strategy.
One popular chart pattern is the “Head and Shoulders” pattern, which indicates a potential reversal in an uptrend. This pattern consists of three peaks, with the middle peak being the highest, resembling the shape of a head and shoulders. Traders often interpret a breakdown below the neckline of this pattern as a signal to sell.
Another commonly seen chart pattern is the “Double Bottom” pattern. This pattern appears when the price reaches a low, bounces back, and then falls to the same low again before reversing higher. This formation is often considered a bullish signal, as it suggests a potential trend reversal to the upside.
The “Ascending Triangle” pattern is characterized by a flat upper trendline and a rising lower trendline. This pattern is typically seen as a continuation pattern, indicating that an uptrend is likely to continue. Traders may interpret a breakout above the upper trendline as a signal to buy.
These are just a few examples of chart patterns that traders commonly analyze on Trading View. Each pattern has its own interpretation and significance, and it’s important to study and understand them to make informed trading decisions.
On Trading View, you can easily identify and analyze chart patterns using the drawing tools and indicators provided. The trendline drawing tool allows you to draw diagonal lines across the chart to identify support and resistance levels, forming the basis of chart pattern analysis.
Additionally, Trading View provides various chart pattern recognition indicators that can automatically identify and highlight chart patterns on your charts. These indicators, such as the “Autochartist” or “PatternBot,” scan the market and generate alerts when specific chart patterns are detected.
When analyzing chart patterns, it’s important to consider other factors as well, such as volume, market sentiment, and fundamental analysis. Chart patterns should not be seen as standalone signals but as part of a comprehensive analysis approach.
By integrating chart pattern analysis into your trading strategy, you can enhance your ability to identify potential entry and exit points. Understanding the nuances of different chart patterns and their implications will assist you in making more informed trading decisions.
In the next section, we will explore the various drawing tools and annotations available on Trading View, which can further enhance your chart analysis capabilities.
Drawing Tools and Annotations
Drawing tools and annotations are valuable features provided by Trading View that allow traders to mark up and annotate their charts. These tools enable you to visually highlight important areas, identify key levels, and make notes for future reference.
Trading View offers a wide range of drawing tools, including trend lines, channels, Fibonacci retracement levels, and shapes. These tools can be accessed from the toolbar on the right side of the screen, making it easy to apply them to your charts.
One of the most commonly used drawing tools is the trend line. Trend lines help identify the direction and strength of a trend by connecting a series of higher lows or lower highs. They can be used to determine support and resistance levels or to project potential price targets.
Channels are another useful drawing tool. They consist of parallel trend lines that enclose price action within a defined range. Channels can help traders recognize areas of consolidation and potential breakouts or breakdowns.
Fibonacci retracement levels are often utilized to identify potential support and resistance levels based on the Fibonacci sequence. With Trading View’s Fibonacci tool, you can easily draw retracement levels on your chart and analyze the price’s reaction at these levels.
Additionally, Trading View provides other annotation tools, such as text boxes, arrows, and shapes, which allow you to add notes and mark important areas on your charts. This feature is useful for documenting observations, recording trading ideas, or even collaborating with other traders.
When using drawing tools and annotations, it’s essential to ensure they do not clutter your chart and create confusion. Use these tools selectively and purposefully to emphasize key aspects of your analysis.
Furthermore, Trading View allows you to easily edit, move, or delete your drawings and annotations. Simply select the specific drawing or annotation on your chart, and a menu will appear with options to modify or remove it.
In addition to the drawing tools provided by Trading View, you can also install community-developed custom scripts and indicators that enhance your chart analysis capabilities. These custom tools offer additional functionality and can be found in the public script library.
By leveraging the drawing tools and annotations available on Trading View, you can visually enhance your chart analysis, mark important levels, and make notes that assist in your trading decision-making process. In the next section, we will explore the social and community features of Trading View.
Using Trading View’s Social and Community Features
Trading View offers a vibrant social and community aspect that enhances the trading experience and provides opportunities for collaboration and information sharing among traders. Leveraging these social features can offer valuable insights, ideas, and support from a diverse community of traders.
One of the key social features on Trading View is the ability to follow other traders and view their published ideas. By following successful traders, you can gain access to their trade ideas, analysis, and market insights, which can help you expand your knowledge and improve your strategies.
The “Ideas” section on Trading View serves as a platform where traders can publish their trading ideas and analysis. Here, you can find a wide range of published ideas from various traders, spanning different asset classes and trading strategies. You can explore these ideas, leave comments, and engage in discussions with the authors and other traders.
Trading View’s social features also include the option to join chat rooms and connect with like-minded traders. Chat rooms provide a space for real-time discussions, market analysis, and sharing of trading ideas. Engaging with other traders in these chat rooms can expand your network, foster learning opportunities, and keep you updated with the latest market developments.
Furthermore, Trading View offers a social network-like platform where traders can create profiles and interact with one another. You can view and connect with other traders, share your thoughts and analysis, and receive feedback on your trading ideas.
Trading View allows traders to “like” and comment on published ideas, creating an interactive and collaborative environment. This feedback mechanism fosters a sense of community and encourages constructive discussions among traders.
Another unique aspect of Trading View’s community features is the ability to form or join trading teams. Trading teams allow traders to collaborate, share ideas, and discuss strategies in a private setting. This feature is particularly useful for group analysis or for trading teams looking to collaborate and exchange insights.
By utilizing Trading View’s social and community features, you can tap into the collective wisdom of the trading community, gain exposure to different trading perspectives, and enhance your trading skills. Engaging with other traders, sharing ideas, and receiving feedback can provide valuable learning experiences and foster personal growth as a trader.
In the next section, we will explore the process of importing and exporting data on Trading View, which can be beneficial for expanding your analysis capabilities.
Importing and Exporting Data
Trading View allows users to import and export data, providing flexibility and expanding the analysis capabilities of the platform. By importing data from external sources or exporting data for use in other applications, traders can enhance their analysis and explore new opportunities.
To import data into Trading View, you can utilize the platform’s data import feature. This allows you to bring in data from other sources, such as spreadsheets or CSV files. By importing external data, you can incorporate additional information or conduct specific analyses that are not available through the standard data feeds provided by Trading View.
By accessing the “Import” functionality, you can select the file containing the data you want to import. Trading View supports various file formats, including CSV, TXT, and Excel files. Once the data is successfully imported, you can use it in your analysis by overlaying it on your charts or incorporating it into your customized indicators.
In addition to importing data, Trading View also offers the option to export chart data. This feature allows you to extract historical price data or study specific segments of the market. Exporting data can be useful for conducting further analysis outside of Trading View or integrating it into other trading tools or platforms.
To export chart data on Trading View, you can access the “Export Data” function. This enables you to specify the time range and market data that you want to export. The exported data can be downloaded in various formats, such as CSV, TXT, or Excel, depending on your preferences and requirements.
Exported data can be used for various purposes, including backtesting trading strategies, conducting statistical analysis, or building custom models. By having access to historical price data, you can gain deeper insights into market patterns and improve the accuracy of your trading decisions.
Importing and exporting data on Trading View provides traders with the flexibility to integrate external data sources and utilize Trading View as a hub for their analysis. This feature enhances the capabilities of the platform and empowers traders to explore new possibilities and refine their strategies.
In the next section, we will delve into the advanced features and pro editions available on Trading View, catering to the needs of more experienced and professional traders.
Exploring Advanced Features and Pro Editions
Trading View offers a range of advanced features and pro editions designed to cater to the needs of experienced and professional traders. These enhanced capabilities provide additional tools and functionalities to optimize your trading and analysis on the platform.
One notable advanced feature is the ability to create custom indicators and trading strategies using Trading View’s Pine Script programming language. This powerful feature allows you to develop and backtest your own indicators and strategies, providing a higher level of customization and control over your analysis.
Pine Script offers a comprehensive set of functions and syntax, enabling you to access historical and real-time data, create custom calculations, generate alerts, and much more. By leveraging Pine Script, you can create unique indicators and automated trading systems that align with your specific trading approach.
In addition to custom indicators, advanced charting capabilities are available in the pro editions of Trading View. Pro users gain access to enhanced charting features, including extended trading hours, custom intervals, and the ability to create up to 10 custom indicators per chart.
Pro editions also provide access to a broader range of real-time data feeds, allowing you to analyze and trade different markets more comprehensively. With real-time data from various exchanges and markets, you can stay on top of price movements, monitor multiple asset classes, and make timely trading decisions.
Furthermore, Trading View Pro editions offer priority customer support, giving you direct access to a dedicated team of professionals who can assist you with any platform-related inquiries or technical issues you may encounter. This level of support ensures that you receive prompt assistance and can continue trading with confidence.
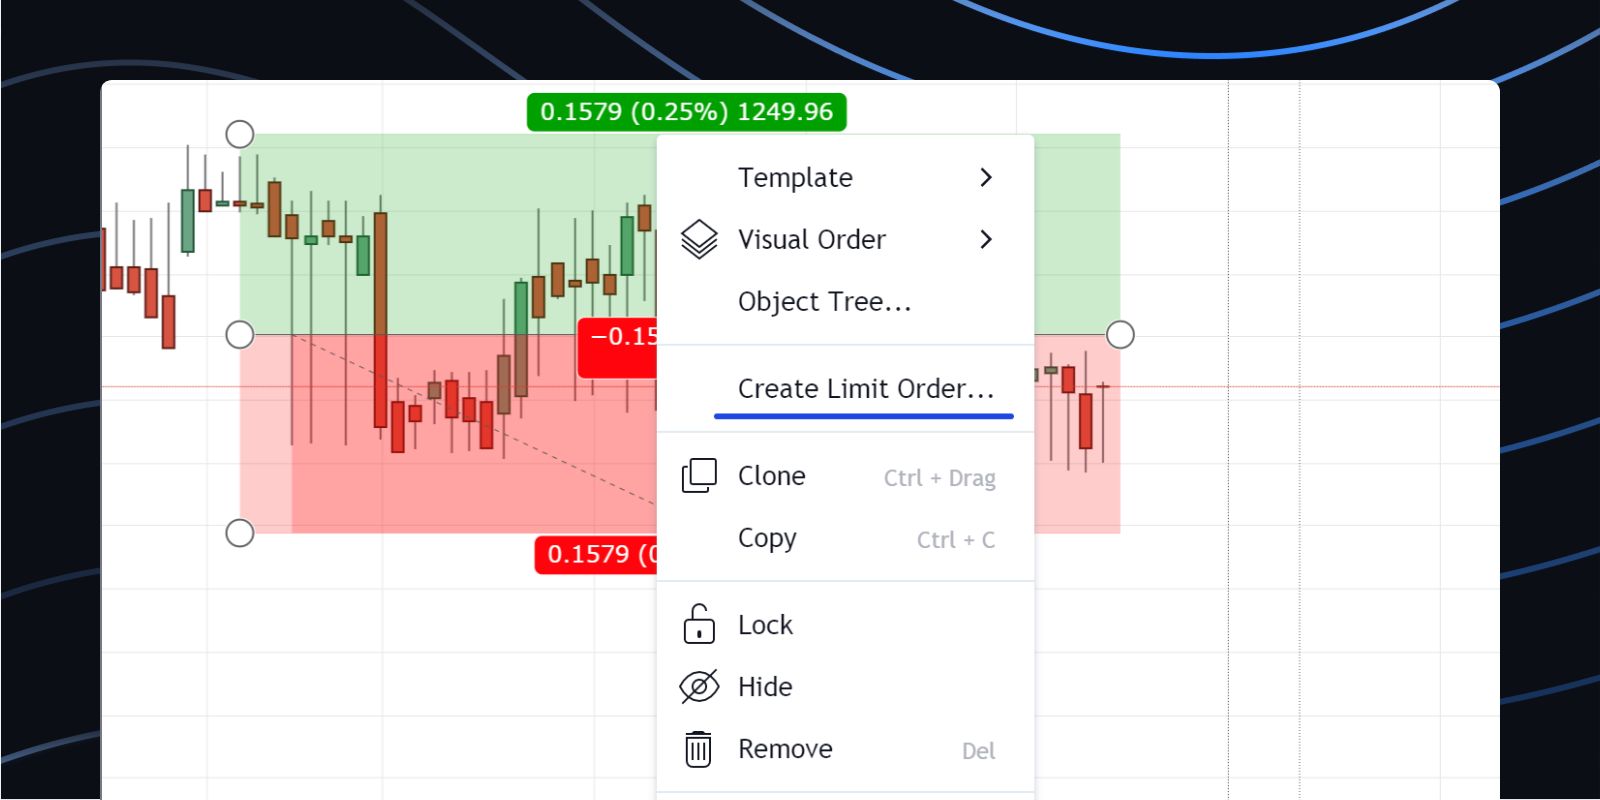
Another valuable feature available in the pro editions is advanced order types. Pro users gain access to order types beyond the standard market and limit orders, such as stop-loss orders, take-profit orders, and trailing stop orders. These advanced order types allow for more precise trade execution and risk management.
Pro editions also provide additional storage capacity for saved chart layouts and custom watchlists. This allows you to save and organize more comprehensive analysis setups, watchlists, and trading ideas without restrictions.
Trading View’s pro editions are designed to cater to the needs of professional traders who require advanced tools, customization options, and enhanced capabilities. By exploring these advanced features and pro editions, you can take your trading and analysis to a higher level.
In the next section, we will wrap up this guide and summarize the key points covered in our exploration of Trading View’s features.
Conclusion
Trading View is a powerful and versatile platform that offers a wide range of features and tools to enhance your trading and analysis experience. From its intuitive interface to customizable charts, technical indicators, and social community features, Trading View provides a comprehensive ecosystem for traders of all levels.
By creating an account on Trading View, you gain access to a wealth of resources to support your trading journey. Whether you’re a beginner looking to learn the basics or an experienced trader seeking advanced features, Trading View has something to offer.
Through this guide, we have explored the process of creating an account, navigating the Trading View interface, setting up and customizing charts, utilizing technical indicators, saving and loading chart layouts, analyzing chart patterns, using drawing tools and annotations, leveraging social and community features, and importing/exporting data.
We have also discussed the advanced features and pro editions available on Trading View, offering enhanced functionality and tools for professional traders.
By understanding and utilizing these features, you can optimize your trading strategies, gain valuable insights from the trading community, and make informed trading decisions.
Remember, Trading View is not only a platform for charting and analysis but also a community where you can connect with other traders, share ideas, and collaborate for a more enriched trading experience.
Whether you’re a day trader, swing trader, or long-term investor, Trading View provides the tools and resources to support your trading goals. Explore the various features, experiment with different strategies, and continue to expand your knowledge and skills as a trader.
Start your Trading View journey today and take your trading to the next level. Happy trading!