Introduction
Welcome to the world of Activity Monitor on Mac! If you’ve ever wondered what’s going on behind the scenes of your Mac, Activity Monitor is a powerful tool that can provide you with valuable insights. Whether you’re a beginner or an advanced user, this guide will walk you through everything you need to know about Activity Monitor, from accessing it to monitoring and managing various aspects of your Mac’s performance.
Activity Monitor is a built-in application on Mac that allows you to keep tabs on your system’s CPU usage, memory usage, disk activity, network activity, and more. It provides a detailed overview of the processes and resources running on your Mac, enabling you to identify any performance issues or resource-hogging applications.
With Activity Monitor, you can take a closer look at which applications are consuming the most resources, troubleshoot performance bottlenecks, and even force-quit unresponsive or problematic processes. Whether you’re a casual user looking to optimize your Mac’s performance or a tech-savvy professional troubleshooting complex issues, Activity Monitor is an invaluable tool in your arsenal.
In this comprehensive guide, we’ll explore the different aspects of Activity Monitor, from understanding its interface to monitoring CPU usage, memory usage, disk activity, and network activity. Additionally, we’ll delve into how to manage processes with Activity Monitor, and how to leverage its troubleshooting capabilities to identify and resolve issues.
So, whether you’re curious to see which apps are draining your Mac’s resources, or you want to keep a close eye on your system’s performance, join us on this journey as we unravel the mysteries of Activity Monitor and empower you to get the most out of your Mac.
Part 1: What is Activity Monitor
If you’re new to Mac or haven’t explored Activity Monitor yet, you might be wondering what exactly it is and why it’s worth your attention.
Activity Monitor is a system utility on Mac that provides real-time monitoring of various aspects of your computer’s performance. It gives you an insight into the processes and resources that are running on your Mac, allowing you to identify any performance issues or resource-intensive applications.
With Activity Monitor, you can track important system metrics such as CPU usage, memory usage, disk activity, and network activity. This information can be invaluable in diagnosing performance problems or identifying applications that may be causing your Mac to slow down.
Let’s take a closer look at some of the key features and benefits of using Activity Monitor:
- Monitoring System Resource Usage: Activity Monitor lets you keep track of your Mac’s resource utilization, highlighting which processes are using the most CPU, memory, disk, or network resources. This can help you identify any resource-hogging apps or processes that may be affecting your system’s performance.
- Identifying Performance Bottlenecks: By analyzing the data provided by Activity Monitor, you can pinpoint performance bottlenecks and determine if certain apps or processes are causing your Mac to lag or freeze. This information allows you to take necessary actions, such as closing unnecessary applications or upgrading hardware, to improve your Mac’s overall performance.
- Troubleshooting Application Issues: If you encounter issues with specific applications, Activity Monitor can provide valuable insights into their behavior. You can use it to identify if an app is unresponsive, consuming excessive resources, or causing unusual network activity. Armed with this information, you can force-quit problematic applications or troubleshoot them further.
- Monitoring Battery Usage: Activity Monitor also allows you to monitor the power consumption of various applications, helping you identify apps that may be draining your Mac’s battery more quickly. This can be especially useful for MacBook users who want to optimize battery life.
Now that we have a basic understanding of what Activity Monitor is and its key benefits, let’s dive into how to access this powerful utility on your Mac.
Part 2: Accessing Activity Monitor on Mac
Now that we know what Activity Monitor is, let’s learn how to access it on your Mac. There are a few different ways to open Activity Monitor:
- Using Spotlight Search: Press
Command + Spaceto open Spotlight Search, then type “Activity Monitor” and pressEnterto launch the application. - Using Finder: Open a new Finder window, navigate to
Applications > Utilities, and then double-click on “Activity Monitor” to open it. - Using Launchpad: Open Launchpad, either by clicking on its icon in the dock or using the
F4function key, and then type “Activity Monitor” in the search bar. Click on the app’s icon to open it.
Once you launch Activity Monitor, you’ll be greeted with a detailed and dynamic interface that provides a wealth of information about your Mac’s processes and system resources.
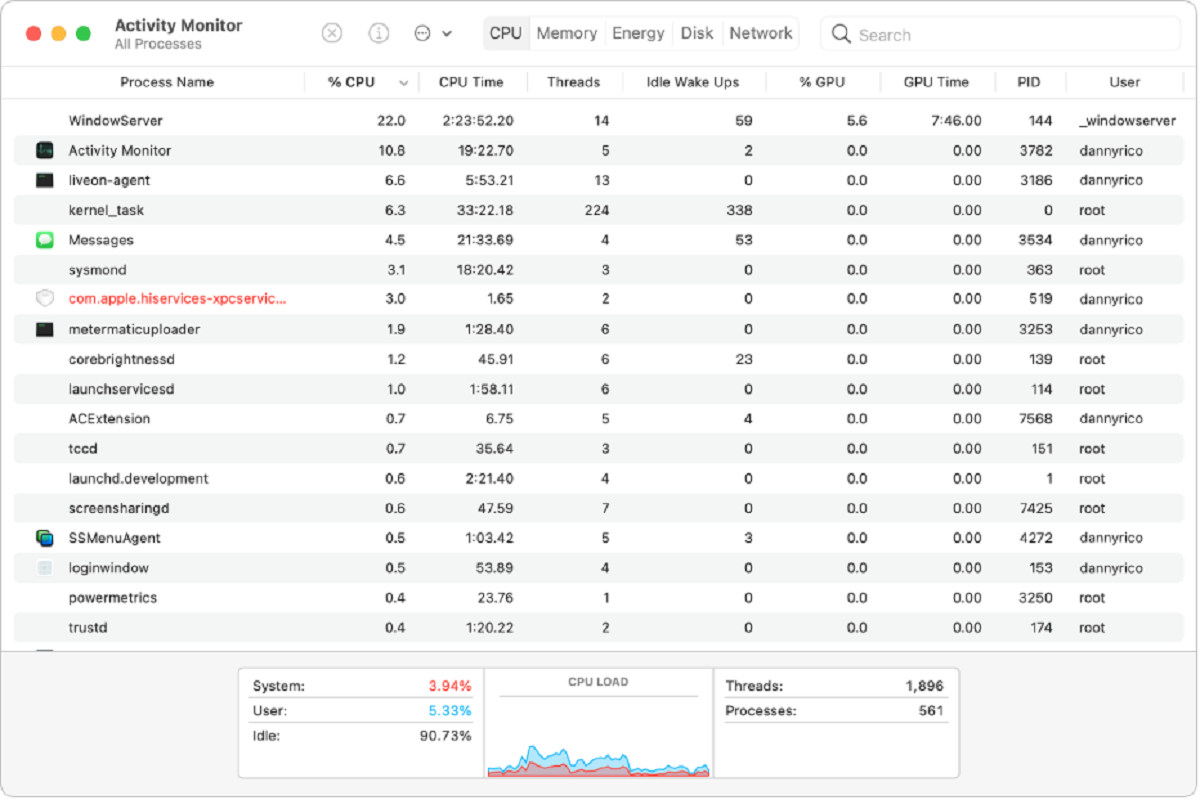
The main window of Activity Monitor is divided into multiple sections:
- Toolbar: Located at the top of the window, the toolbar provides quick access to various monitoring categories, options to customize the view, and buttons to refresh or stop processes.
- Tabs: Below the toolbar, you’ll find several tabs, including CPU, Memory, Energy, Disk, and Network. These tabs allow you to navigate between different types of system information.
- Process Table: The largest section of the window is occupied by the process table, which displays a list of all running processes on your Mac. Each row represents a different process, and columns provide details such as the process name, user, CPU usage, and memory usage.
- Graphs and Statistics: Activity Monitor also provides real-time graphs and statistics at the bottom of the window for visualizing the usage of various system resources.
By default, Activity Monitor displays all processes running on your Mac, but you can customize the view by sorting processes based on specific criteria or filtering them to see only certain types of processes.
Now that we know how to access Activity Monitor and understand its interface, let’s explore the different monitoring categories available and how to utilize them to gain insights into your Mac’s performance.
Part 3: Understanding Activity Monitor’s Interface
Activity Monitor’s interface may seem a bit overwhelming at first glance, but once you understand its different components, you’ll be able to navigate and interpret the information with ease.
Let’s take a closer look at the key elements of Activity Monitor’s interface:
- Toolbar: The toolbar at the top of the Activity Monitor window provides quick access to various monitoring categories, including CPU, Memory, Energy, Disk, and Network. You can switch between these categories to view specific system information.
- Tabs: Located just below the toolbar, the tabs allow you to navigate between different types of system information. Each tab corresponds to a specific category, such as CPU, Memory, or Disk. Clicking on a tab will display detailed data and graphs related to that category.
- Process Table: The main section of the Activity Monitor window is occupied by the process table. This table displays a list of all running processes on your Mac. Each row represents a different process, and columns provide information such as process name, user, assigned CPU usage, memory usage, energy impact, disk activity, and network activity.
- Graphs and Statistics: At the bottom of the Activity Monitor window, you’ll find real-time graphs and statistics related to the currently selected category. These graphs visually represent the usage of system resources, such as CPU, memory, disk, or network. The statistics provide numerical values corresponding to the utilization of those resources.
By default, the process table displays all processes running on your Mac. However, you can customize the view by sorting the processes based on specific criteria. Simply click on the column header to sort the processes by that attribute, such as CPU usage or memory usage. You can also use the Filter box to search for specific processes or filter them by criteria like application name or process ID.
Additionally, Activity Monitor allows you to customize the appearance and behavior of the app. You can go to the Preferences menu to choose the information that is displayed in the process table, set the update frequency of the graphs and statistics, and configure other settings according to your preferences.
Now that you have a better understanding of Activity Monitor’s interface and its various components, let’s dive into the specific categories of system information that you can monitor and how to interpret them.
Part 4: Monitoring CPU Usage
One of the key features of Activity Monitor is its ability to monitor and analyze CPU usage on your Mac. The CPU (Central Processing Unit) is the brain of your computer, responsible for executing tasks and running processes. Monitoring CPU usage can help you identify applications or processes that may be causing a high load on your system.
To monitor CPU usage in Activity Monitor, follow these steps:
- Open Activity Monitor on your Mac by using one of the methods mentioned earlier.
- Click on the “CPU” tab in the toolbar to switch to the CPU monitoring category.
- The CPU section displays a list of processes and their corresponding CPU usage. The processes consuming a significant amount of CPU resources will be listed at the top.
- You can sort the processes by CPU usage by clicking on the “% CPU” column header. This will help you identify which processes are using the most CPU power.
- Activity Monitor also provides a real-time graph at the bottom of the window that shows the overall CPU usage of your system.
By monitoring CPU usage, you can identify any resource-intensive applications or processes that may be causing your Mac to slow down or overheat. If you notice that a particular process is consistently consuming a high amount of CPU resources, it may be worth investigating further or considering terminating it if it’s unnecessary.
If you want to take control over CPU usage, Activity Monitor also allows you to manage processes. You can select a process and click on the “X” button in the toolbar to force quit it. However, exercise caution when terminating processes, as abruptly ending certain system processes or critical applications can have adverse effects on your system stability.
Now that you know how to monitor CPU usage using Activity Monitor, you can keep an eye on resource-intensive processes and ensure optimal performance for your Mac.
Part 5: Monitoring Memory Usage
Monitoring memory usage is another important aspect of maintaining optimal performance on your Mac. Memory, also known as RAM (Random Access Memory), is a crucial resource that allows your computer to run applications and processes smoothly. Activity Monitor can help you track and analyze memory usage on your Mac.
To monitor memory usage in Activity Monitor, follow these steps:
- Open Activity Monitor on your Mac using one of the methods mentioned earlier.
- Click on the “Memory” tab in the toolbar to switch to the memory monitoring category.
- The memory section displays information about physical memory, virtual memory, and memory pressure.
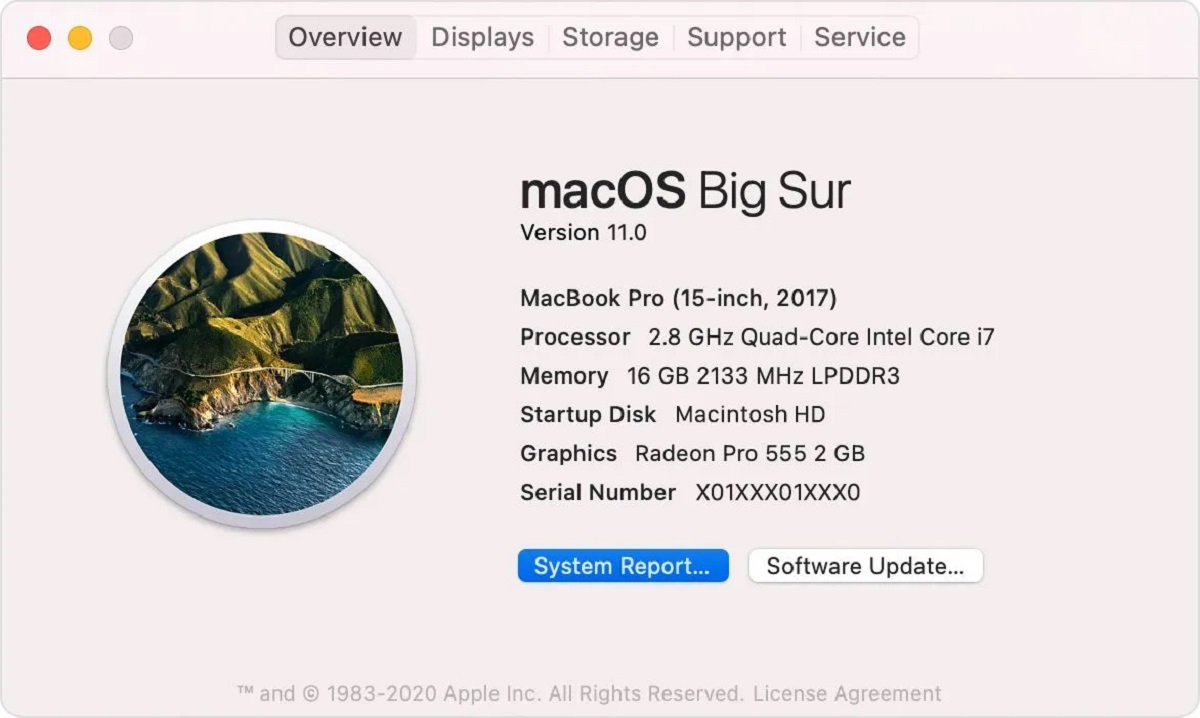
- Physical memory, also known as RAM, shows the total amount of memory installed on your Mac and how it is currently being used.
- Virtual memory represents the total amount of memory your Mac is capable of using, including both RAM and disk space.
- Memory pressure is an indicator that shows you how much pressure your system’s memory is under. Green indicates low pressure, yellow indicates moderate pressure, and red indicates high pressure.
- Activity Monitor also provides real-time graphs at the bottom of the window that visually represent memory usage and memory pressure.
By monitoring memory usage, you can determine if your Mac is experiencing memory-related performance issues. If you notice that your memory usage is consistently high or the memory pressure is frequently in the red zone, it may be worth investigating further.
To optimize memory usage, you can take several actions:
- Quit unnecessary applications: Close any applications that you’re not actively using to free up memory resources.
- Identify memory-hogging processes: Sort the processes in the process table by memory usage to identify which applications are consuming the most memory. You can quit or manage these processes if they are not necessary.
- Check for memory leaks: Certain applications may have memory leaks, causing them to consume excessive memory over time. If you notice any applications consistently taking up a large amount of memory, it may indicate a memory leak, and you can consider updating or reinstalling the application.
By actively monitoring memory usage and optimizing it when necessary, you can ensure smooth and efficient operation of your Mac.
Part 6: Tracking Disk Activity
Monitoring disk activity can provide valuable insights into how your Mac’s storage is being utilized and can help identify any potential issues or bottlenecks. Activity Monitor allows you to track disk activity and gain a deeper understanding of how your data is being read from or written to the disk.
To track disk activity in Activity Monitor, follow these steps:
- Open Activity Monitor on your Mac using one of the methods mentioned earlier.
- Click on the “Disk” tab in the toolbar to switch to the disk monitoring category.
- The disk section displays information about data read and data written for each disk or volume connected to your Mac.
- Activity Monitor provides real-time graphs that show disk activity, including data read and data written.
- By default, all disks and volumes are displayed. However, you can use the drop-down menu to select a specific disk or volume to monitor.
Tracking disk activity can help you identify any processes or applications that are reading or writing a significant amount of data to your disk. This can be useful in troubleshooting slow performance or identifying applications that may be overusing storage resources.
If you notice excessive disk activity, you can take a few actions to optimize it:
- Clean up your disk: Remove unnecessary files or applications to free up storage space and improve disk performance.
- Identify resource-hogging processes: Sort the processes in the process table by data read or data written to identify any applications or processes that are utilizing a significant amount of disk activity. You can then assess if these processes are necessary or if they can be optimized.
- Check for disk errors: If you suspect disk issues, you can use Disk Utility, another built-in Mac application, to run a disk check and repair any errors.
By monitoring disk activity and taking proactive steps to optimize it when necessary, you can ensure efficient storage usage and maintain the health and performance of your Mac’s disk.
Part 7: Monitoring Network Activity
Monitoring network activity on your Mac can provide valuable insights into how your system is interacting with the internet and other devices on your network. Activity Monitor allows you to track network activity and analyze data usage, helping you identify any issues or bandwidth-consuming processes.
To monitor network activity in Activity Monitor, follow these steps:
- Open Activity Monitor on your Mac using one of the methods mentioned earlier.
- Click on the “Network” tab in the toolbar to switch to the network monitoring category.
- The network section displays information about network usage, including data sent and received by your Mac.
- You can view network activity for each network interface, such as Wi-Fi or Ethernet, by selecting the desired interface from the drop-down menu.
- Activity Monitor provides real-time graphs that show network usage, including data sent and received, as well as a cumulative graph showing the total network activity over time.
By monitoring network activity, you can identify any processes or applications that may be consuming excessive network bandwidth or causing network-related issues. This can be beneficial in troubleshooting slow internet connections or addressing applications that are using an unusually large amount of data.
If you notice high network activity or data usage, here are a few actions you can take:
- Identify bandwidth-consuming processes: Sort the processes in the process table by network usage to identify applications or processes that may be utilizing a significant amount of network bandwidth. You can then assess if these processes are necessary or if they can be optimized.
- Monitor background processes: Some applications or services may run in the background and consume network resources. In the network section of Activity Monitor, you can monitor specific processes to identify potential culprits and take necessary actions.
- Restrict data usage: If you have limited network bandwidth or need to optimize data usage, you can adjust settings within specific applications or system preferences to reduce data consumption.
By actively monitoring network activity and taking steps to optimize it when necessary, you can ensure efficient use of network resources and maintain a smooth internet experience on your Mac.
Part 8: Managing Processes with Activity Monitor
Activity Monitor not only allows you to monitor various aspects of your Mac’s performance, but it also gives you the capability to manage processes effectively. Being able to manage processes can help you optimize system resources, troubleshoot performance issues, and improve overall efficiency.
Here are some key process management features available in Activity Monitor:
- Force Quitting Processes: If you encounter an unresponsive or problematic application, you can select it from the process table in Activity Monitor and click on the “X” button in the toolbar to force quit it. This can be useful in situations where an application becomes frozen or is causing issues.
- Terminating Processes: Activity Monitor allows you to terminate specific processes that are consuming excessive resources or causing performance problems. When you select a process and click on the “Quit Process” button in the toolbar, you can safely terminate the process, freeing up system resources.
- Suspending Processes: In some cases, you may want to temporarily suspend a process to reduce its impact on system performance. Activity Monitor provides an option to suspend a process, which effectively puts it on hold until you decide to resume it.
- Adjusting Process Priorities: Activity Monitor allows you to adjust the priority of processes, giving you control over how system resources are allocated. By changing the priority, you can allocate more CPU power or memory to processes that require it, ensuring optimal performance for critical applications or tasks.
It’s important to exercise caution when managing processes in Activity Monitor. Force quitting or terminating certain system processes or critical applications can have unintended consequences and may lead to system instability or data loss. Ensure that you are familiar with the processes you are managing and the potential impact of your actions.
By effectively managing processes in Activity Monitor, you can optimize system resources, troubleshoot and resolve performance issues, and ensure smooth operation of your Mac.
Part 9: Troubleshooting with Activity Monitor
Activity Monitor is a powerful tool that can assist you in troubleshooting various issues on your Mac. By analyzing the data it provides and monitoring system resources, you can identify and resolve performance problems effectively.
Here are some ways you can utilize Activity Monitor for troubleshooting:
- Identifying Resource-Hogging Applications: Activity Monitor allows you to pinpoint which applications or processes are using excessive CPU, memory, disk, or network resources. By identifying these resource-hogging applications, you can take necessary actions such as quitting or optimizing them, thereby improving overall system performance.
- Monitoring System Performance Metrics: Activity Monitor provides real-time data on various system performance metrics, including CPU usage, memory usage, disk activity, and network activity. By monitoring these metrics, you can identify abnormal behavior or performance bottlenecks, enabling you to take appropriate actions to address the underlying issues.
- Suspending or Quitting Unresponsive Processes: If you encounter an application or process that becomes unresponsive, you can use Activity Monitor to suspend or force quit it. This can help unfreeze your system and resolve issues caused by unresponsive processes.
- Tracking Down Memory Leaks: Memory leaks can cause a gradual increase in memory usage over time, leading to performance issues. Activity Monitor can help you identify processes that are consuming a large amount of memory and potentially causing memory leaks. By addressing these memory-hogging processes, you can mitigate memory-related problems.
- Monitoring Network Connectivity: If you’re experiencing connectivity issues or slow internet speeds, monitoring network activity in Activity Monitor can help you identify processes that are utilizing excessive network resources or causing network-related problems. This information can assist in troubleshooting and resolving network connectivity issues.
Utilizing Activity Monitor for troubleshooting requires careful analysis and interpretation of the data it provides. It is important to understand the normal behavior of your system and identify any anomalies or patterns that may indicate underlying issues. In addition, keep in mind that Activity Monitor is just one tool in your troubleshooting arsenal, and it may be necessary to use other utilities or seek further support for complex problems.
By harnessing the power of Activity Monitor, you can effectively troubleshoot issues on your Mac, optimize performance, and ensure a smooth and efficient computing experience.
Conclusion
Activity Monitor is an invaluable tool for Mac users, offering comprehensive monitoring and management capabilities for various aspects of system performance. Whether you’re a casual user looking to optimize your Mac’s performance or a tech-savvy professional troubleshooting complex issues, Activity Monitor provides the insights you need to keep your Mac running smoothly.
Throughout this guide, we’ve explored the different features of Activity Monitor, from accessing it on your Mac to understanding its interface and utilizing its various monitoring categories. We’ve learned how to track CPU usage, monitor memory usage, analyze disk activity, and monitor network activity. Additionally, we’ve discovered how to manage processes effectively and troubleshoot issues using Activity Monitor.
By harnessing the power of Activity Monitor, you can take control of your Mac’s performance, identify resource-intensive applications, troubleshoot problems, and optimize system resources. Whether you’re seeking to free up memory, identify performance bottlenecks, or troubleshoot network connectivity issues, Activity Monitor provides the necessary information to make informed decisions and take appropriate actions.
Remember to use Activity Monitor in conjunction with other troubleshooting tools and methods to ensure a comprehensive approach to resolving issues. As with any system utility, it’s important to use Activity Monitor responsibly and understand the potential impact of managing processes or terminating applications.
In conclusion, Activity Monitor empowers you to be proactive in managing your Mac’s performance, identifying and resolving issues, and ensuring a smooth and efficient experience. By utilizing the insights and data provided by Activity Monitor, you can optimize your Mac’s resources, improve performance, and have greater control over your system.