Introduction
Web Inspector is a powerful tool that allows developers to delve into the inner workings of websites and web applications. It provides a comprehensive set of features for inspecting, debugging, and optimizing web content, making it an indispensable asset for web developers and designers. Whether you're a seasoned professional or just starting out in web development, understanding how to leverage Web Inspector can significantly enhance your workflow and productivity.
With Web Inspector, you can peek behind the curtain of a webpage to analyze its structure, styles, and scripts. This tool empowers you to identify and rectify issues, optimize performance, and gain valuable insights into the behavior of web elements. It's like having x-ray vision for the web, allowing you to see the underlying code, network activity, and performance metrics.
In this article, we'll explore the ins and outs of Web Inspector in Safari, shedding light on its features, functionalities, and practical applications. Whether you're a web development enthusiast, a curious explorer, or a seasoned professional seeking to expand your knowledge, this guide will equip you with the essential know-how to harness the full potential of Web Inspector. So, let's embark on this journey to unravel the mysteries of web development and discover the wonders of Web Inspector in Safari.
Overview of Web Inspector
Web Inspector is a robust and multifaceted tool integrated into the Safari web browser, designed to facilitate the inspection, debugging, and optimization of web content. It provides a comprehensive suite of features that empower developers to dissect and analyze the various components of a webpage, including its structure, styles, and scripts. With Web Inspector, users can gain deep insights into the inner workings of web elements, enabling them to identify issues, enhance performance, and refine the user experience.
At its core, Web Inspector serves as a window into the underlying code and resources that constitute a webpage. It offers a detailed view of the Document Object Model (DOM), allowing developers to visualize the hierarchical structure of HTML elements and their relationships. This feature is invaluable for understanding the composition of a webpage and diagnosing layout issues, as it provides a real-time representation of how the browser interprets the HTML document.
Furthermore, Web Inspector provides comprehensive support for inspecting and manipulating Cascading Style Sheets (CSS). Developers can effortlessly examine the styles applied to individual elements, diagnose layout inconsistencies, and experiment with live style changes to observe their immediate impact on the webpage's appearance. This capability streamlines the process of fine-tuning the visual presentation of web content, fostering a more efficient and iterative approach to front-end development.
In addition to its prowess in dissecting the structure and styles of webpages, Web Inspector offers robust debugging capabilities for JavaScript and other web technologies. Developers can set breakpoints, inspect variables, and trace the execution flow of scripts, empowering them to identify and rectify logic errors, performance bottlenecks, and unexpected behaviors within their web applications.
Moreover, Web Inspector provides comprehensive network analysis tools, allowing developers to monitor network requests, examine response data, and diagnose performance issues related to resource loading. This feature enables users to optimize the loading times of web content, identify potential bottlenecks, and ensure a seamless and responsive user experience.
In essence, Web Inspector serves as a Swiss army knife for web developers, offering a rich set of tools and functionalities to streamline the development and optimization of web content. Its comprehensive suite of features empowers developers to gain deep insights, diagnose issues, and optimize the performance of web applications, making it an indispensable companion in the realm of web development.
How to Access Web Inspector in Safari
Accessing Web Inspector in Safari is a straightforward process that grants developers direct access to the inner workings of web content. Whether you're keen on inspecting the structure of a webpage, analyzing its styles, debugging JavaScript, or monitoring network activity, Web Inspector provides a comprehensive toolkit for these tasks. To access Web Inspector in Safari, follow these simple steps:
-
Open Safari Browser: Launch the Safari web browser on your Mac or iOS device.
-
Navigate to the Webpage: Visit the webpage that you intend to inspect and analyze. This could be a live website, a locally hosted web application, or any web content accessible through Safari.
-
Access the Develop Menu: In the Safari menu bar, navigate to "Develop." If the Develop menu is not visible, you can enable it by going to Safari Preferences > Advanced and checking the "Show Develop menu in menu bar" option.
-
Select "Show Web Inspector": Once the Develop menu is accessible, hover over the "Develop" option to reveal a dropdown menu. From the dropdown menu, select "Show Web Inspector." Alternatively, you can use the keyboard shortcut "Option + Command + I" to open Web Inspector swiftly.
-
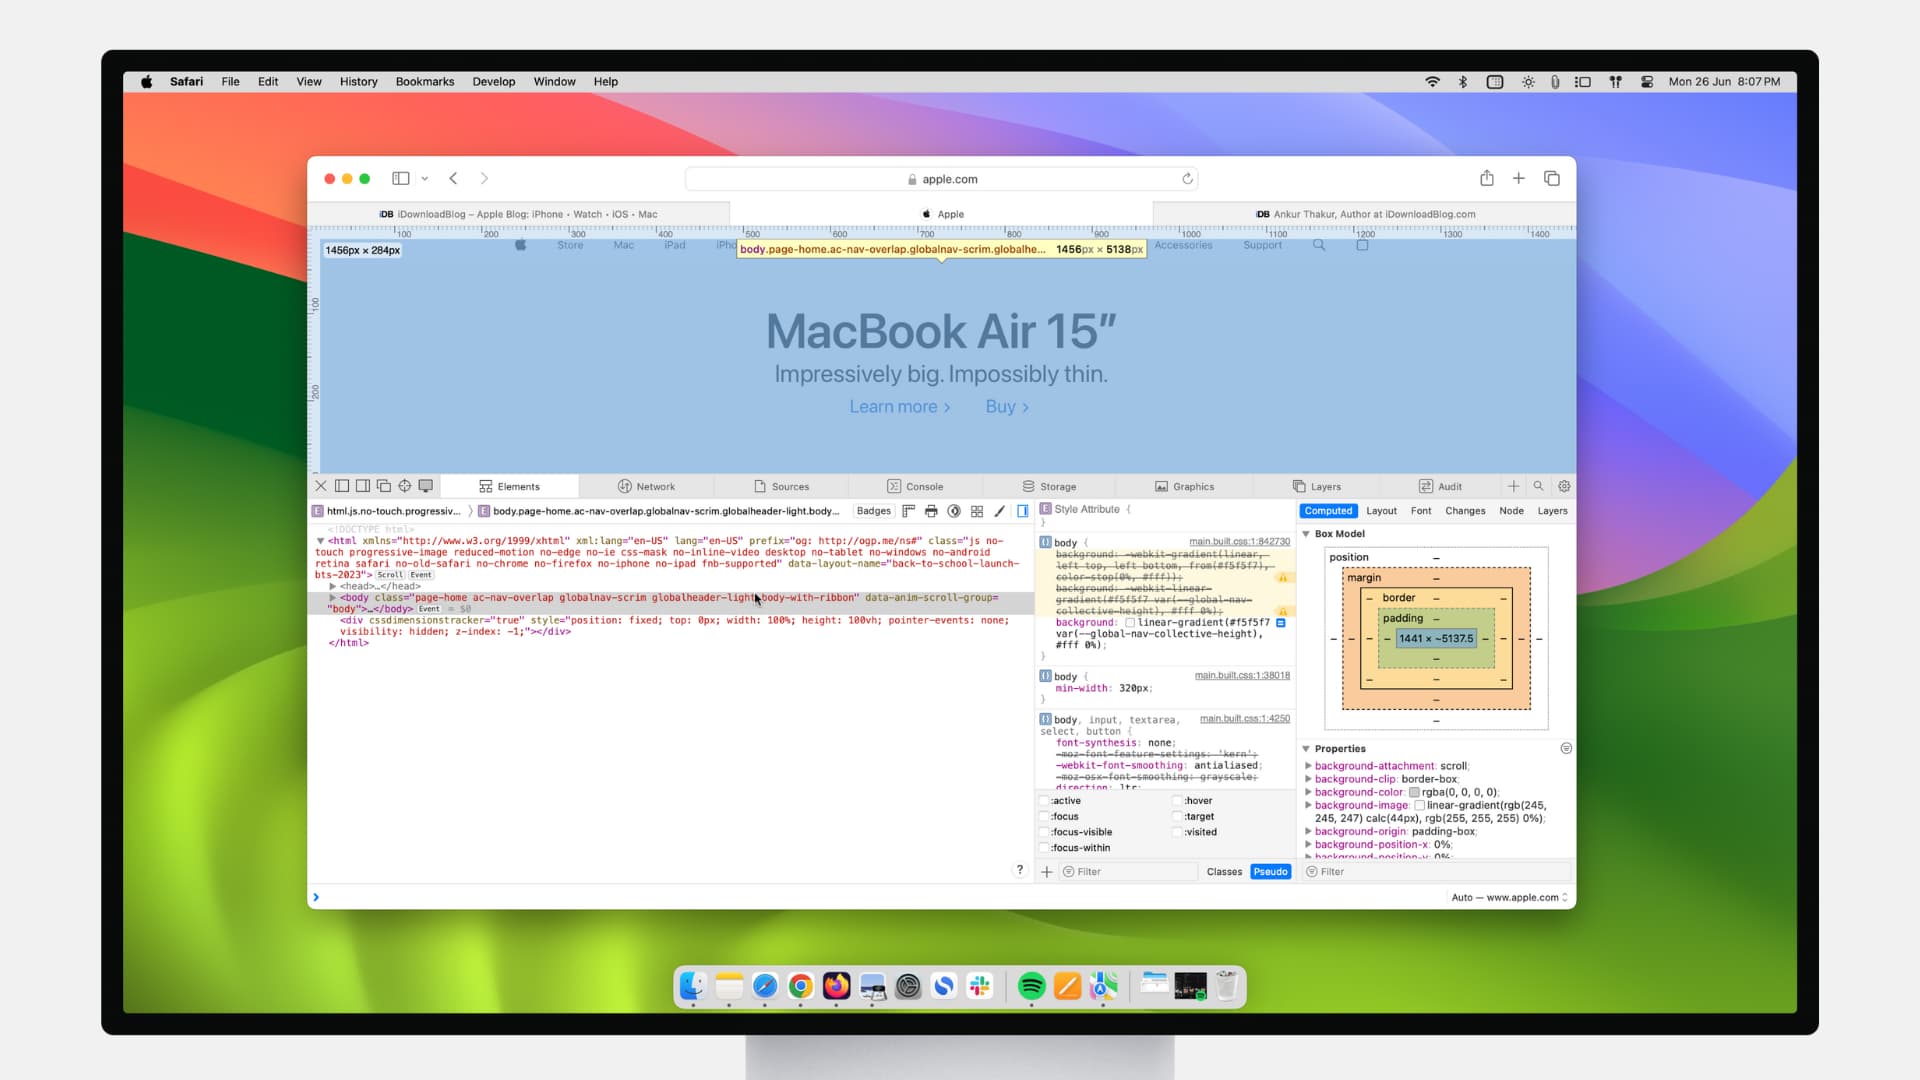
Explore Web Inspector: Upon selecting "Show Web Inspector," the Web Inspector panel will appear, providing a comprehensive view of the webpage's structure, styles, scripts, and network activity. You can navigate through the various tabs and panels within Web Inspector to inspect and analyze different aspects of the webpage.
By following these steps, you can seamlessly access Web Inspector in Safari and unlock its powerful capabilities for web development and debugging. Whether you're a seasoned developer or a curious enthusiast, delving into the inner workings of web content through Web Inspector can provide valuable insights and facilitate the optimization of web applications and websites.
In summary, accessing Web Inspector in Safari is a fundamental step in leveraging its robust features for web development, debugging, and optimization. By mastering the art of accessing and utilizing Web Inspector, developers can gain a deeper understanding of web content and enhance their ability to create compelling and performant web experiences.
Features of Web Inspector
Web Inspector in Safari boasts a rich array of features that empower developers to dissect, analyze, and optimize web content with precision and efficiency. From inspecting the structure and styles of web elements to debugging JavaScript and monitoring network activity, Web Inspector offers a comprehensive toolkit for enhancing the development and performance of web applications and websites.
Document Object Model (DOM) Inspection
Web Inspector provides a detailed view of the Document Object Model (DOM), allowing developers to visualize the hierarchical structure of HTML elements and their relationships. This feature enables users to inspect, modify, and understand the composition of a webpage in real time, facilitating the diagnosis of layout issues and the manipulation of web elements with ease.
Cascading Style Sheets (CSS) Analysis
With Web Inspector, developers can delve into the styles applied to individual elements, diagnose layout inconsistencies, and experiment with live style changes to observe their immediate impact on the webpage's appearance. This capability streamlines the process of fine-tuning the visual presentation of web content, fostering a more efficient and iterative approach to front-end development.
JavaScript Debugging
Web Inspector offers robust debugging capabilities for JavaScript and other web technologies. Developers can set breakpoints, inspect variables, and trace the execution flow of scripts, empowering them to identify and rectify logic errors, performance bottlenecks, and unexpected behaviors within their web applications.
Network Analysis
Web Inspector provides comprehensive network analysis tools, allowing developers to monitor network requests, examine response data, and diagnose performance issues related to resource loading. This feature enables users to optimize the loading times of web content, identify potential bottlenecks, and ensure a seamless and responsive user experience.
Resource Inspection
Developers can inspect and analyze various resources loaded by a webpage, including images, scripts, stylesheets, and other assets. This feature provides valuable insights into resource loading times, sizes, and dependencies, enabling developers to optimize the performance and efficiency of web content.
Timeline Recording
Web Inspector offers a timeline recording feature that allows developers to capture and analyze the timeline of events, including JavaScript execution, rendering performance, and network activity. This capability is instrumental in identifying performance bottlenecks and optimizing the responsiveness of web applications.
Memory and Performance Analysis
Developers can leverage Web Inspector to analyze memory usage, performance profiles, and runtime behaviors of web applications. This feature facilitates the identification of memory leaks, performance optimizations, and overall improvements in the efficiency of web content.
In essence, the features of Web Inspector in Safari collectively form a comprehensive toolkit for web development, debugging, and optimization. By harnessing these capabilities, developers can gain deep insights, diagnose issues, and optimize the performance of web applications, making Web Inspector an indispensable asset in the realm of web development.
Using Web Inspector for Web Development
Web Inspector serves as an invaluable companion for web developers, offering a robust set of tools and functionalities to streamline the development, debugging, and optimization of web content. By leveraging the capabilities of Web Inspector, developers can gain deep insights, diagnose issues, and enhance the performance and user experience of web applications and websites.
Real-time Inspection and Debugging
One of the primary benefits of using Web Inspector for web development is the ability to inspect and manipulate web elements in real time. Developers can navigate through the Document Object Model (DOM) to understand the structure of a webpage, modify elements, and observe the immediate impact on the layout and presentation. This real-time inspection capability facilitates the diagnosis and resolution of layout issues, ensuring a seamless and visually appealing user experience.
Furthermore, Web Inspector empowers developers to debug JavaScript and other web technologies with precision. By setting breakpoints, inspecting variables, and tracing the execution flow of scripts, developers can identify and rectify logic errors, performance bottlenecks, and unexpected behaviors within their web applications. This debugging prowess is instrumental in ensuring the reliability and functionality of web content.
Optimizing Styles and Layout
Web Inspector provides comprehensive support for inspecting and manipulating Cascading Style Sheets (CSS), enabling developers to fine-tune the visual presentation of web content. By analyzing the styles applied to individual elements, diagnosing layout inconsistencies, and experimenting with live style changes, developers can refine the aesthetic appeal and responsiveness of web applications. This iterative approach to optimizing styles and layout fosters a more efficient and visually compelling web development process.
Performance Analysis and Optimization
Developers can harness the network analysis tools within Web Inspector to monitor network requests, examine response data, and diagnose performance issues related to resource loading. By optimizing the loading times of web content, identifying potential bottlenecks, and ensuring a seamless user experience, developers can elevate the performance and responsiveness of web applications. Additionally, the timeline recording and memory analysis features enable developers to identify performance bottlenecks, memory leaks, and runtime behaviors, facilitating the optimization of web applications for enhanced efficiency.
In essence, using Web Inspector for web development empowers developers to gain deep insights, diagnose issues, and optimize the performance and user experience of web applications and websites. By seamlessly integrating Web Inspector into the development workflow, developers can leverage its rich set of tools and functionalities to create compelling, performant, and visually appealing web experiences.
Conclusion
In conclusion, Web Inspector in Safari stands as a formidable ally for web developers, offering a comprehensive suite of features and functionalities to dissect, analyze, and optimize web content. From its prowess in inspecting the Document Object Model (DOM) to its robust debugging capabilities for JavaScript and network analysis tools, Web Inspector equips developers with the tools they need to elevate the quality and performance of web applications and websites.
By providing real-time insights into the structure, styles, and scripts of web elements, Web Inspector empowers developers to diagnose layout issues, optimize styles, and ensure a visually compelling user experience. The ability to manipulate and experiment with web elements in real time streamlines the development process, fostering an iterative approach to refining the presentation and functionality of web content.
Moreover, the debugging capabilities of Web Inspector enable developers to identify and rectify logic errors, performance bottlenecks, and unexpected behaviors within their web applications. This ensures the reliability and functionality of web content, contributing to a seamless and intuitive user experience.
Additionally, the network analysis tools and timeline recording features within Web Inspector facilitate the optimization of resource loading times, the identification of performance bottlenecks, and the enhancement of the responsiveness of web applications. By monitoring network requests, examining response data, and capturing the timeline of events, developers can fine-tune the performance and efficiency of web content, ensuring a seamless user experience across various devices and network conditions.
In essence, Web Inspector serves as a catalyst for innovation and excellence in web development, providing developers with the insights and tools they need to create compelling, performant, and visually appealing web experiences. Whether you're delving into the intricacies of web elements, debugging JavaScript, or optimizing network performance, Web Inspector empowers you to unlock the full potential of web content.
As the digital landscape continues to evolve, Web Inspector remains a steadfast companion for developers, offering a dynamic toolkit to navigate the complexities of web development and deliver exceptional user experiences. Embracing the capabilities of Web Inspector is not just a choice; it's a strategic advantage in the pursuit of crafting immersive and impactful web experiences for users around the globe.