Introduction
Debugging is an essential skill for web developers, and Safari provides powerful tools to help identify and fix issues in web applications. Whether you're dealing with JavaScript errors, CSS layout problems, or network issues, Safari's Web Inspector offers a comprehensive set of features to streamline the debugging process.
When it comes to debugging in Safari, having a solid understanding of the Web Inspector is crucial. This tool not only allows you to inspect and modify the structure and layout of a web page but also provides advanced capabilities for debugging JavaScript, analyzing network activity, and optimizing performance.
In this article, we'll delve into the various features of Safari's Web Inspector and explore how it can be leveraged to debug web applications effectively. From setting breakpoints in JavaScript code to analyzing network requests and responses, we'll cover the essential techniques that can help you identify and resolve issues in your web projects.
By mastering the art of debugging in Safari, you'll be better equipped to tackle a wide range of challenges that commonly arise during web development. Whether you're a seasoned developer or just starting your journey in web development, understanding how to leverage Safari's debugging tools can significantly enhance your productivity and proficiency in building robust web applications.
So, let's embark on this exploration of Safari's debugging capabilities and discover how these tools can empower you to overcome obstacles and create exceptional web experiences. Whether you're troubleshooting a complex JavaScript function or fine-tuning the layout of a web page, Safari's Web Inspector is your trusted companion in the quest for flawless web development.
Using the Web Inspector
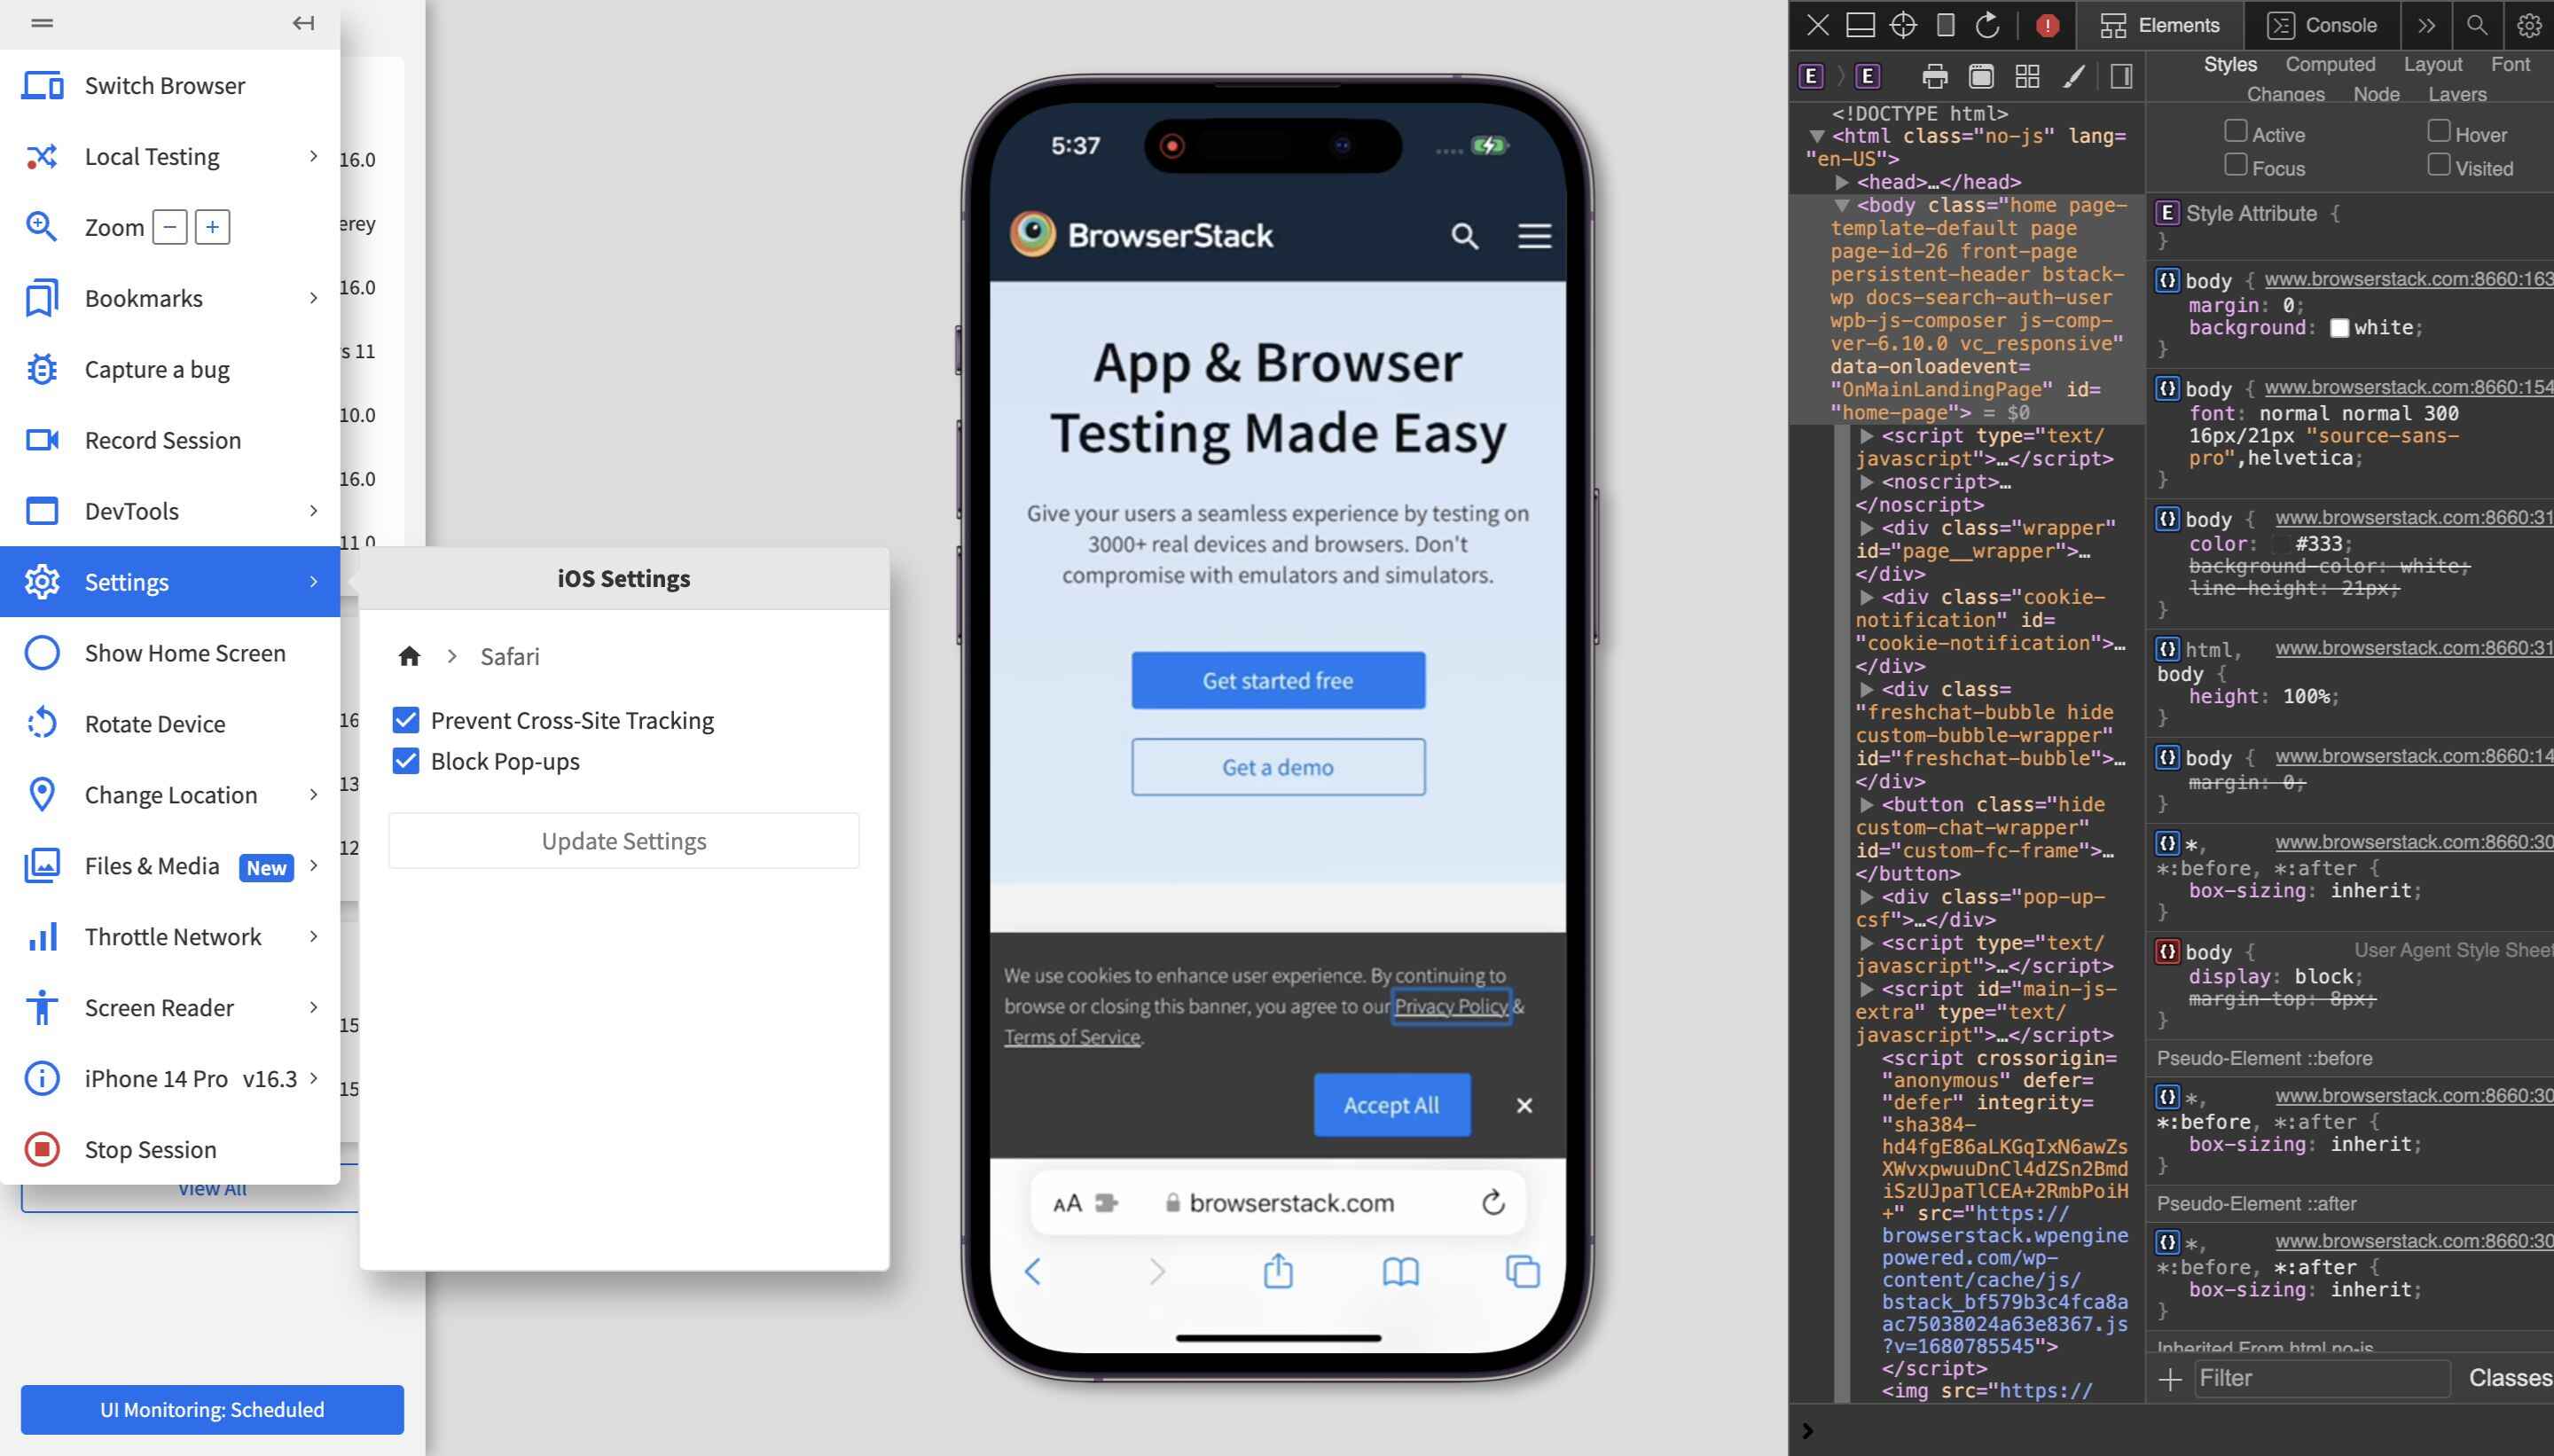
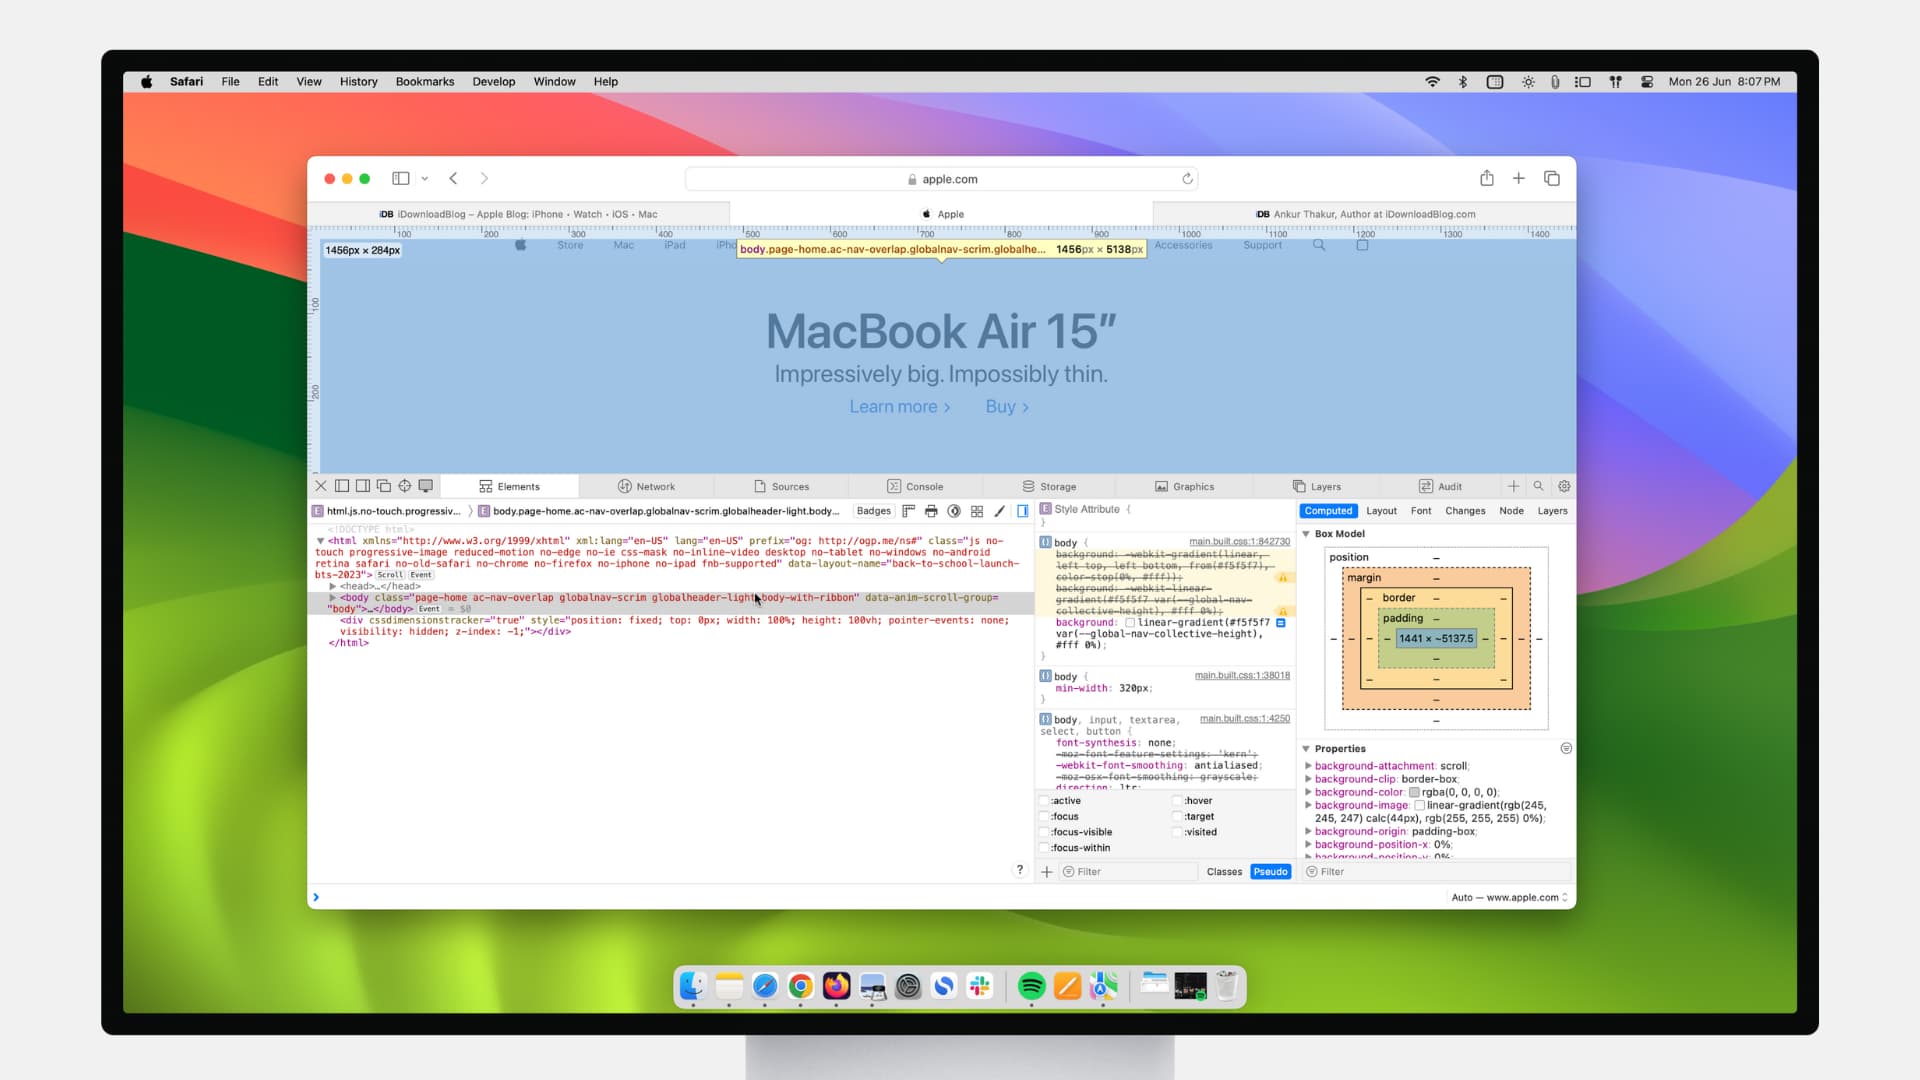
The Web Inspector in Safari is a versatile tool that provides a comprehensive set of features for debugging and optimizing web applications. To access the Web Inspector, simply right-click on an element within a web page and select "Inspect Element" from the context menu. Alternatively, you can use the keyboard shortcut Command + Option + I to open the Web Inspector.
Once the Web Inspector is open, you'll be greeted with a plethora of tabs and panels, each serving a specific debugging or analysis purpose. The Elements tab allows you to inspect and modify the HTML and CSS of the page, making it invaluable for troubleshooting layout and styling issues. You can also use the Styles panel to view and modify the CSS rules applied to a selected element, providing real-time feedback as you make adjustments.
The Console tab is a powerful tool for debugging JavaScript code. It not only displays errors and warnings but also allows you to execute JavaScript commands and interact with the page in real time. By leveraging the Console, you can log messages, inspect variables, and even run JavaScript expressions, making it an indispensable asset for identifying and resolving JavaScript-related issues.
The Sources tab is where you can delve into the JavaScript code powering the web page. Here, you can set breakpoints, step through code, and inspect variables, enabling you to pinpoint the root cause of JavaScript errors and unexpected behavior. The debugger capabilities offered in the Sources tab empower you to gain deep insights into the execution flow of your JavaScript code, facilitating efficient debugging and troubleshooting.
Furthermore, the Network tab provides a detailed overview of network activity, allowing you to analyze network requests, view response headers, and identify potential performance bottlenecks. This tab is instrumental in optimizing the loading times of web pages and diagnosing network-related issues that may impact the user experience.
In addition to these core features, the Web Inspector offers a host of other tools and functionalities, including the Performance and Memory tabs, which enable you to analyze and optimize the performance and memory usage of web applications.
By mastering the usage of the Web Inspector in Safari, you can streamline the debugging process, identify and resolve issues efficiently, and optimize the performance of your web applications. Whether you're troubleshooting layout inconsistencies, debugging JavaScript code, or analyzing network activity, the Web Inspector equips you with the essential tools to elevate the quality and reliability of your web projects.
Setting Breakpoints
Setting breakpoints in JavaScript code is a fundamental technique for debugging and gaining insights into the execution flow of a web application. In Safari's Web Inspector, the Sources tab provides a seamless interface for setting breakpoints, stepping through code, and examining variables, empowering developers to identify and resolve issues with precision.
To set a breakpoint in Safari, navigate to the Sources tab within the Web Inspector. Once there, locate the JavaScript file containing the code you wish to debug. By clicking on the line number in the left-hand gutter of the code editor, you can set a breakpoint, indicated by a blue marker. This action instructs the browser to pause execution at the specified line of code, allowing you to inspect the state of variables and analyze the program's behavior at that particular juncture.
Upon setting a breakpoint, you can interact with the web page as usual, and when the execution reaches the designated line of code, the browser halts, and the debugger becomes active. At this point, you can leverage the debugger controls, such as stepping through the code, resuming execution, and inspecting variables, to gain a comprehensive understanding of the program's behavior.
Furthermore, Safari's Web Inspector offers advanced breakpoint options, including conditional breakpoints and event listener breakpoints. Conditional breakpoints enable you to specify a condition that triggers the breakpoint, allowing for more targeted debugging based on specific criteria. This feature is particularly useful for isolating issues that occur under specific circumstances, such as when a variable reaches a certain value or a particular function is called.
Event listener breakpoints, on the other hand, allow you to pause execution when a specific type of event is triggered, such as a click or a keypress. This capability is invaluable for debugging event-driven interactions and understanding how the application responds to user input.
By harnessing the power of breakpoints in Safari's Web Inspector, developers can gain deep insights into the behavior of their JavaScript code, identify and resolve issues efficiently, and optimize the functionality of web applications. Whether you're troubleshooting complex logic errors, analyzing variable values, or examining event-driven behavior, setting breakpoints in Safari's Web Inspector is a cornerstone of effective JavaScript debugging.
Using the Console
The Console tab in Safari's Web Inspector is a versatile and powerful tool for debugging JavaScript code and interacting with web pages in real time. It serves as a command-line interface for executing JavaScript commands, logging messages, inspecting variables, and diagnosing issues within web applications.
One of the primary functions of the Console is to display errors, warnings, and informational messages generated by JavaScript code running on the web page. When an error occurs, it is logged in the Console, along with a stack trace that provides valuable insights into the sequence of function calls leading to the error. This feature is invaluable for identifying and addressing JavaScript-related issues, such as syntax errors, undefined variables, or unexpected behavior.
In addition to error logging, the Console allows developers to execute JavaScript commands directly within the context of the web page. This capability enables real-time interaction with the page's elements and functionality, making it an indispensable asset for experimenting with code, testing hypotheses, and gaining a deeper understanding of the application's behavior.
Furthermore, the Console provides a platform for logging messages and inspecting variables, allowing developers to track the flow of their JavaScript code and gain visibility into the values of variables at different stages of execution. By strategically placing log statements and variable inspections within the code, developers can effectively trace the program's behavior and pinpoint the root cause of issues, facilitating efficient debugging and troubleshooting.
Moreover, the Console supports the execution of JavaScript expressions, providing a means to evaluate and manipulate the state of the web page dynamically. This feature is particularly useful for experimenting with DOM manipulation, testing API calls, and verifying the behavior of custom JavaScript functions, empowering developers to validate and refine their code in real time.
By leveraging the capabilities of the Console in Safari's Web Inspector, developers can streamline the process of debugging JavaScript code, gain real-time insights into the behavior of web applications, and interact with the page dynamically to validate and refine their code. Whether you're logging messages, inspecting variables, or executing JavaScript commands, the Console is a vital component of Safari's debugging toolkit, empowering developers to elevate the quality and reliability of their web projects.
Network Tab
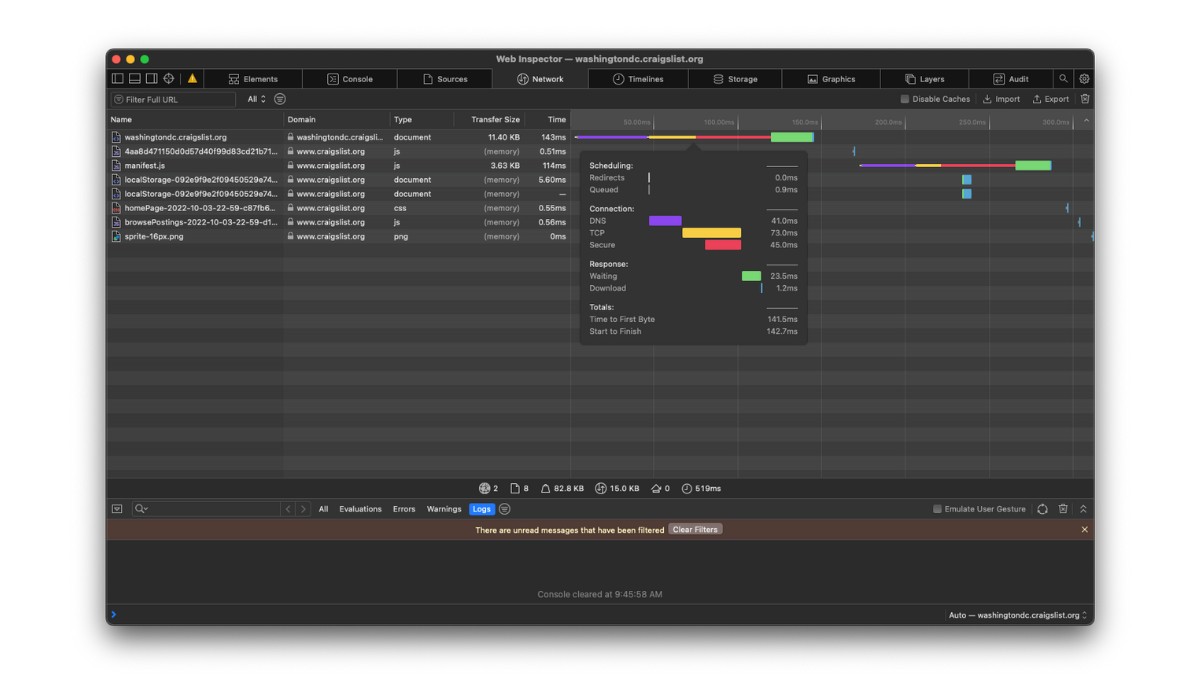
The Network tab in Safari's Web Inspector is a vital component for analyzing network activity and optimizing the performance of web applications. By providing detailed insights into network requests, responses, and loading times, the Network tab equips developers with the tools to diagnose potential bottlenecks, identify inefficiencies, and streamline the delivery of web content.
Upon navigating to the Network tab within the Web Inspector, developers are presented with a comprehensive overview of network activity, including a timeline of requests, detailed information about each request, and performance metrics such as request and response headers, status codes, and loading times. This wealth of data enables developers to gain a deep understanding of how web pages interact with the network, empowering them to optimize the loading times and responsiveness of their applications.
One of the key features of the Network tab is the ability to inspect individual network requests, allowing developers to analyze the headers, payloads, and timing information associated with each request. By examining the details of network requests, developers can identify potential performance bottlenecks, such as slow-loading resources, excessive redirects, or inefficient caching policies, and take proactive measures to address these issues.
Furthermore, the Network tab provides valuable insights into the loading times of various resources, enabling developers to pinpoint elements that contribute to prolonged page load times. By analyzing the timeline of network requests, developers can identify opportunities to optimize resource loading, reduce latency, and enhance the overall responsiveness of web applications, ultimately improving the user experience.
In addition to analyzing individual network requests, the Network tab offers advanced filtering and sorting capabilities, allowing developers to focus on specific types of requests, such as XHR (XMLHttpRequest) or fetch requests, and gain a targeted view of network activity. This functionality is instrumental in diagnosing issues related to AJAX interactions, API calls, and resource loading, providing developers with the insights needed to fine-tune the network performance of their applications.
By leveraging the capabilities of the Network tab in Safari's Web Inspector, developers can gain a comprehensive understanding of network activity, optimize the loading times of web applications, and diagnose potential performance bottlenecks. Whether you're analyzing request headers, inspecting loading times, or filtering network activity, the Network tab is an indispensable tool for enhancing the efficiency and responsiveness of web applications.
Resources Tab
The Resources tab in Safari's Web Inspector is a treasure trove of information, providing developers with comprehensive insights into the resources utilized by web applications. From examining the structure of web pages to analyzing the loading times of individual resources, the Resources tab offers a wealth of data to empower developers in optimizing the performance and reliability of their applications.
Upon navigating to the Resources tab within the Web Inspector, developers are presented with a detailed overview of the resources associated with the current web page. This includes a comprehensive breakdown of resources such as HTML documents, stylesheets, scripts, images, fonts, and other assets, enabling developers to gain a holistic view of the components that contribute to the functionality and visual presentation of the web application.
One of the key features of the Resources tab is the ability to inspect individual resources, allowing developers to delve into the details of each resource and gain insights into its loading behavior, size, and caching status. By examining the properties of individual resources, developers can identify opportunities to optimize resource delivery, reduce file sizes, and leverage caching strategies to enhance the overall performance of the web application.
Furthermore, the Resources tab provides valuable metrics related to resource loading times, enabling developers to pinpoint elements that contribute to prolonged page load times. By analyzing the loading timeline of resources, developers can identify potential bottlenecks, such as large images or slow-loading scripts, and take proactive measures to optimize the loading times and responsiveness of the web application, ultimately improving the user experience.
In addition to analyzing individual resources, the Resources tab offers advanced filtering and sorting capabilities, allowing developers to focus on specific types of resources, such as scripts or images, and gain a targeted view of resource utilization. This functionality is instrumental in diagnosing issues related to resource loading, identifying opportunities for optimization, and ensuring that the web application delivers a seamless and efficient user experience.
By leveraging the capabilities of the Resources tab in Safari's Web Inspector, developers can gain a comprehensive understanding of resource utilization, optimize the loading times of web applications, and diagnose potential performance bottlenecks. Whether you're inspecting individual resources, analyzing loading times, or filtering resource utilization, the Resources tab is an indispensable tool for enhancing the efficiency and reliability of web applications.
Debugging JavaScript Errors
Debugging JavaScript errors is a critical aspect of web development, and Safari's Web Inspector provides a robust set of tools to streamline the process of identifying and resolving JavaScript-related issues. When encountering errors in JavaScript code, developers can leverage the debugging capabilities offered by Safari's Web Inspector to gain deep insights into the root causes of these errors and effectively troubleshoot their web applications.
One of the primary features of Safari's Web Inspector for debugging JavaScript errors is the Console tab. When a JavaScript error occurs on a web page, the Console tab logs detailed information about the error, including the error message, the file and line number where the error occurred, and a stack trace that reveals the sequence of function calls leading to the error. This wealth of information empowers developers to pinpoint the exact location and nature of the error, facilitating efficient diagnosis and resolution.
In addition to error logging, the Console tab allows developers to interact with the JavaScript code in real time, execute JavaScript commands, and inspect variables. By leveraging the Console's capabilities, developers can experiment with code snippets, test hypotheses, and gain a deeper understanding of the behavior of their JavaScript code, ultimately facilitating the process of identifying and addressing errors.
Furthermore, Safari's Web Inspector offers advanced debugging features in the Sources tab, enabling developers to set breakpoints, step through code, and inspect variables to gain insights into the execution flow of their JavaScript code. By setting breakpoints at strategic points in the code, developers can pause the execution of the program and examine the state of variables, facilitating the identification of logic errors, unexpected behavior, and other issues that may lead to JavaScript errors.
Moreover, Safari's Web Inspector provides support for debugging asynchronous JavaScript code, such as AJAX interactions and event-driven behavior. By leveraging the debugger capabilities in the Sources tab, developers can effectively trace the flow of asynchronous operations, analyze callback functions, and diagnose issues related to asynchronous JavaScript execution, empowering them to address errors and optimize the functionality of their web applications.
By harnessing the powerful debugging features offered by Safari's Web Inspector, developers can effectively troubleshoot JavaScript errors, gain deep insights into the behavior of their code, and optimize the reliability and performance of their web applications. Whether you're diagnosing syntax errors, logic errors, or issues related to asynchronous operations, Safari's Web Inspector equips you with the essential tools to elevate the quality and robustness of your JavaScript code.
Debugging CSS Issues
Debugging CSS issues is an integral part of web development, and Safari's Web Inspector provides valuable tools and functionalities to streamline the process of identifying and resolving CSS-related problems. When encountering layout inconsistencies, styling errors, or unexpected visual behavior in web applications, developers can leverage the debugging capabilities offered by Safari's Web Inspector to gain deep insights into the root causes of these issues and effectively troubleshoot their CSS code.
One of the primary features of Safari's Web Inspector for debugging CSS issues is the Elements tab. This tab allows developers to inspect and modify the HTML and CSS of the web page, providing real-time feedback as changes are made. By examining the structure and styling of individual elements, developers can identify discrepancies, analyze the application of CSS rules, and diagnose issues related to layout and visual presentation.
In addition to inspecting individual elements, the Styles panel within the Elements tab offers a comprehensive view of the CSS rules applied to selected elements. This feature enables developers to analyze the cascade and specificity of CSS rules, identify conflicting styles, and troubleshoot issues related to the application of styles to elements. By modifying CSS properties and observing the visual impact in real time, developers can experiment with different styling approaches and validate the effectiveness of their CSS code.
Furthermore, Safari's Web Inspector provides support for analyzing the computed styles of elements, allowing developers to gain insights into the final presentation of elements as determined by the browser's rendering engine. By examining the computed values of CSS properties, developers can verify the application of styles, diagnose discrepancies between expected and actual visual presentation, and identify opportunities to optimize the styling of web elements.
Moreover, the Elements tab offers a powerful feature known as the "Toggle Element State," which allows developers to visualize the layout and styling of elements in various states, such as :hover, :active, and :focus. This capability is invaluable for diagnosing issues related to interactive states and pseudo-classes, enabling developers to ensure consistent and visually appealing behavior across different user interactions.
By harnessing the robust debugging features offered by Safari's Web Inspector, developers can effectively troubleshoot CSS issues, gain deep insights into the styling and layout of their web applications, and optimize the visual presentation and user experience. Whether you're diagnosing layout inconsistencies, analyzing the application of CSS rules, or addressing issues related to interactive states, Safari's Web Inspector equips you with the essential tools to elevate the quality and visual appeal of your web projects.
Conclusion
In conclusion, Safari's Web Inspector stands as a formidable ally for web developers, offering a rich array of features and tools to streamline the debugging process and optimize the performance of web applications. From the comprehensive capabilities of the Elements tab to the powerful debugging functionalities in the Sources tab, Safari's Web Inspector empowers developers to gain deep insights into the structure, behavior, and performance of their web projects.
By mastering the art of debugging in Safari, developers can effectively troubleshoot JavaScript errors, diagnose CSS issues, analyze network activity, and optimize the loading times of web applications. The seamless integration of advanced features, such as setting breakpoints, inspecting network requests, and modifying CSS styles in real time, enables developers to address a wide range of challenges with precision and efficiency.
Furthermore, Safari's Web Inspector serves as a catalyst for continuous improvement, providing developers with the insights and tools needed to refine the functionality, reliability, and visual appeal of their web applications. Whether it's identifying and resolving JavaScript errors, fine-tuning the layout and styling of web elements, or optimizing network performance, Safari's Web Inspector equips developers with the essential capabilities to elevate the quality and user experience of their web projects.
As the digital landscape continues to evolve, the ability to debug and optimize web applications effectively becomes increasingly crucial. Safari's Web Inspector not only meets but exceeds the expectations of developers, offering a robust set of features that cater to the diverse needs of modern web development. By leveraging the capabilities of Safari's Web Inspector, developers can navigate the complexities of web development with confidence, address challenges with precision, and deliver exceptional web experiences that captivate and delight users.
In essence, Safari's Web Inspector is not just a tool; it's a gateway to innovation and excellence in web development. By embracing the power of Safari's debugging tools, developers can embark on a journey of continuous improvement, pushing the boundaries of what's possible in web application development and setting new standards for functionality, performance, and user satisfaction. With Safari's Web Inspector as a trusted companion, developers are poised to conquer the challenges of web development and pave the way for a future where exceptional web experiences are the norm.