Introduction
Welcome to the world of web development and exploration! Have you ever wondered how websites are built and what lies beneath their visually appealing exteriors? Well, you're in for a treat because in this article, we're going to delve into the fascinating realm of source code viewing on Google Chrome.
As you navigate the vast landscape of the internet, you encounter a myriad of websites, each with its own unique design and functionality. Behind every webpage, there exists a hidden language that orchestrates the layout, content, and interactive elements. This language is none other than HTML, CSS, and JavaScript, collectively known as the source code.
Understanding the source code is akin to deciphering the DNA of a website. It unveils the intricate structure and logic that underpins the digital experiences we encounter daily. Whether you're a curious enthusiast, an aspiring web developer, or a seasoned professional, gaining the ability to peek behind the curtains of a webpage can be an enlightening and empowering experience.
In this article, we'll embark on a journey to demystify the process of viewing source code on Chrome, one of the most popular web browsers in the world. By mastering this skill, you'll gain valuable insights into how websites are constructed, troubleshoot layout issues, and even learn from the coding techniques employed by other developers.
So, fasten your seatbelt and get ready to uncover the secrets hidden within the digital realm as we embark on an enlightening exploration of source code viewing on Chrome. Let's dive in and unveil the magic that powers the web!
Accessing the Developer Tools
To embark on our journey of unraveling the mysteries of web development, we first need to gain access to the powerful arsenal of tools that Chrome offers. The gateway to this treasure trove is the Developer Tools, a set of features that enables us to inspect, debug, and modify the structure and behavior of web pages.
Accessing the Developer Tools is a straightforward process. You can simply right-click anywhere on a webpage and select "Inspect" from the context menu. Alternatively, you can use the keyboard shortcut by pressing "Ctrl + Shift + I" (Windows/Linux) or "Cmd + Option + I" (Mac). These actions will open the Developer Tools panel, revealing a plethora of tabs and options that empower you to interact with the underlying code and resources of the webpage.
Once inside the Developer Tools interface, you'll be greeted by a wealth of functionalities designed to aid in the analysis and manipulation of web content. From inspecting the HTML structure to analyzing network activity and debugging JavaScript, the Developer Tools serve as a command center for understanding and modifying the inner workings of web pages.
Furthermore, the Developer Tools are not limited to passive observation; they also facilitate real-time experimentation and tweaking. You can modify CSS styles, manipulate HTML elements, and even execute JavaScript commands directly within the console. This interactive capability empowers developers and enthusiasts to experiment with different design and functionality changes, all within the confines of the browser environment.
In addition to the traditional methods of accessing the Developer Tools, Chrome offers a dedicated menu for accessing these tools. Simply click on the three-dot menu icon in the top-right corner of the browser window, navigate to "More tools," and select "Developer tools." This provides an alternative pathway to unleash the full potential of the Developer Tools, ensuring that you can seamlessly transition between browsing and development activities.
By gaining access to the Developer Tools, you open the door to a world of discovery and innovation. Whether you're a seasoned developer, a curious enthusiast, or a budding web designer, the Developer Tools serve as a gateway to understanding and shaping the digital landscape. So, let's roll up our sleeves and prepare to explore the intricacies of web development with the aid of Chrome's Developer Tools.
Viewing the Source Code
Now that we've gained access to the Developer Tools, let's embark on the exhilarating quest of viewing the source code of a webpage. The source code serves as the blueprint of a website, encompassing the HTML, CSS, and JavaScript that collectively define its structure and behavior.
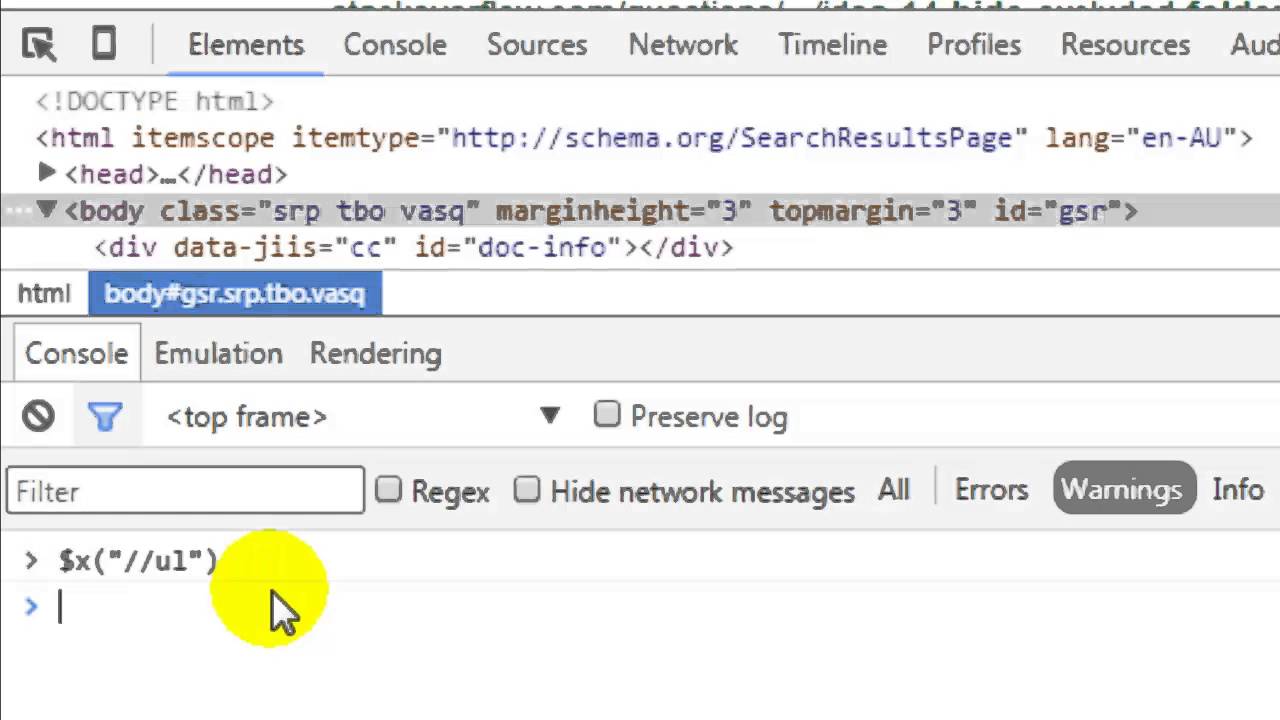
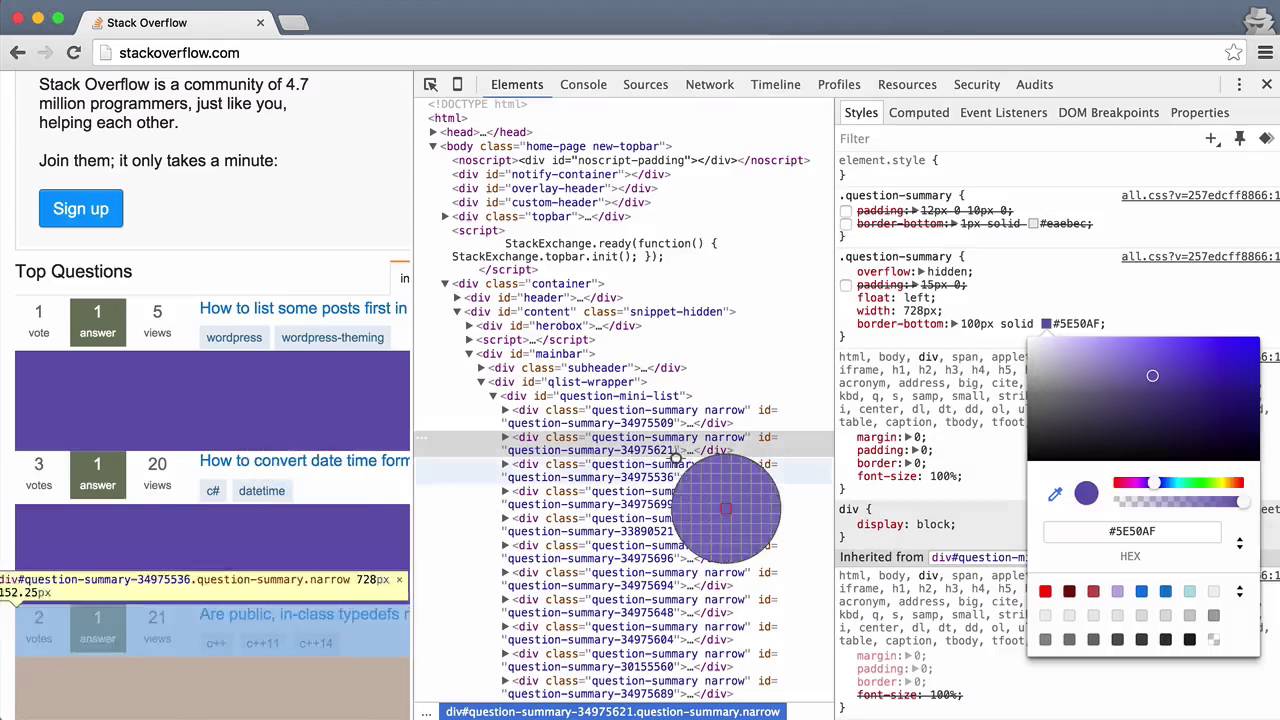
Upon opening the Developer Tools, you'll notice a multitude of tabs at the top of the panel. To view the source code, navigate to the "Elements" tab. This section provides a comprehensive visual representation of the webpage's structure, displaying the HTML elements in a hierarchical manner. As you hover over different elements in the panel, corresponding sections of the webpage will be highlighted, offering a seamless correlation between the source code and its visual manifestation.
Inspecting individual elements within the "Elements" tab unveils a treasure trove of information. You can view and modify the HTML attributes, manipulate CSS styles, and even add or remove elements on the fly. This interactive exploration not only facilitates understanding but also empowers you to experiment with changes and observe their immediate impact on the webpage.
Furthermore, the "Elements" tab offers a feature known as "Live Editing," which allows you to directly edit the HTML and CSS of the webpage. By simply double-clicking on a specific element or style attribute, you can make real-time modifications and witness the instantaneous effects. This dynamic interaction with the source code fosters a deeper understanding of web development principles and instills a sense of hands-on proficiency.
In addition to the visual representation of the source code, the "Elements" tab provides a holistic view of the webpage's resources. This includes the ability to inspect and modify the Document Object Model (DOM), analyze applied CSS styles, and trace the hierarchy of elements within the webpage. Such insights into the inner workings of a webpage empower you to comprehend its construction and behavior from a technical standpoint.
As you navigate through the source code within the "Elements" tab, you'll unravel the intricate web of interconnected elements, styles, and scripts that collectively form the webpage. This immersive experience not only demystifies the underlying technologies but also fosters a profound appreciation for the craftsmanship involved in web development.
In essence, viewing the source code through the "Elements" tab of the Developer Tools is akin to embarking on a captivating journey through the digital architecture of the web. It's a gateway to understanding the building blocks of web development and a catalyst for honing your skills in crafting compelling digital experiences. So, let's continue our exploration and delve deeper into the realms of web development with Chrome as our guiding beacon.
Using the Elements Panel
The Elements panel within Chrome's Developer Tools serves as a gateway to the underlying structure of a webpage, offering a comprehensive and interactive interface for inspecting and manipulating the source code. As you navigate to the Elements tab, a visual representation of the webpage's HTML structure unfolds before your eyes, presenting a hierarchical view of the elements that compose the page.
Upon selecting a specific HTML element within the Elements panel, the corresponding section of the webpage is highlighted, establishing a seamless correlation between the source code and its visual manifestation. This dynamic interaction facilitates a deeper understanding of how the HTML elements contribute to the overall layout and functionality of the webpage.
One of the most compelling features of the Elements panel is the ability to modify the HTML and CSS in real time through live editing. By simply double-clicking on an element or a style attribute, you can directly edit the code and witness the immediate impact on the webpage. This hands-on approach to experimentation empowers you to explore different design variations and instantly observe their effects, fostering a deeper comprehension of the relationship between code and visual output.
Furthermore, the Elements panel provides a wealth of information beyond the HTML structure. It allows you to inspect and modify the Document Object Model (DOM), analyze applied CSS styles, and trace the hierarchy of elements within the webpage. This comprehensive insight into the webpage's resources not only aids in understanding its construction but also facilitates the identification and resolution of layout and styling issues.
In addition to visual inspection and live editing, the Elements panel offers a range of functionalities for debugging and optimization. You can analyze event listeners attached to specific elements, monitor changes in the DOM as the webpage dynamically updates, and even simulate mobile device views to ensure responsive design compatibility.
By leveraging the capabilities of the Elements panel, you gain a profound understanding of the intricate web of interconnected elements, styles, and scripts that collectively form the webpage. This immersive experience not only demystifies the underlying technologies but also fosters a profound appreciation for the craftsmanship involved in web development.
In essence, the Elements panel is a gateway to understanding the building blocks of web development and serves as a catalyst for honing your skills in crafting compelling digital experiences. It empowers you to dissect and comprehend the intricate dance between code and visual presentation, paving the way for a deeper immersion into the art and science of web development.
Using the View Page Source Option
In addition to the robust capabilities offered by the Developer Tools, Google Chrome provides a straightforward method for viewing the page source through the "View Page Source" option. This feature offers a quick and convenient way to access the raw HTML source code of a webpage, providing valuable insights into its underlying structure and content.
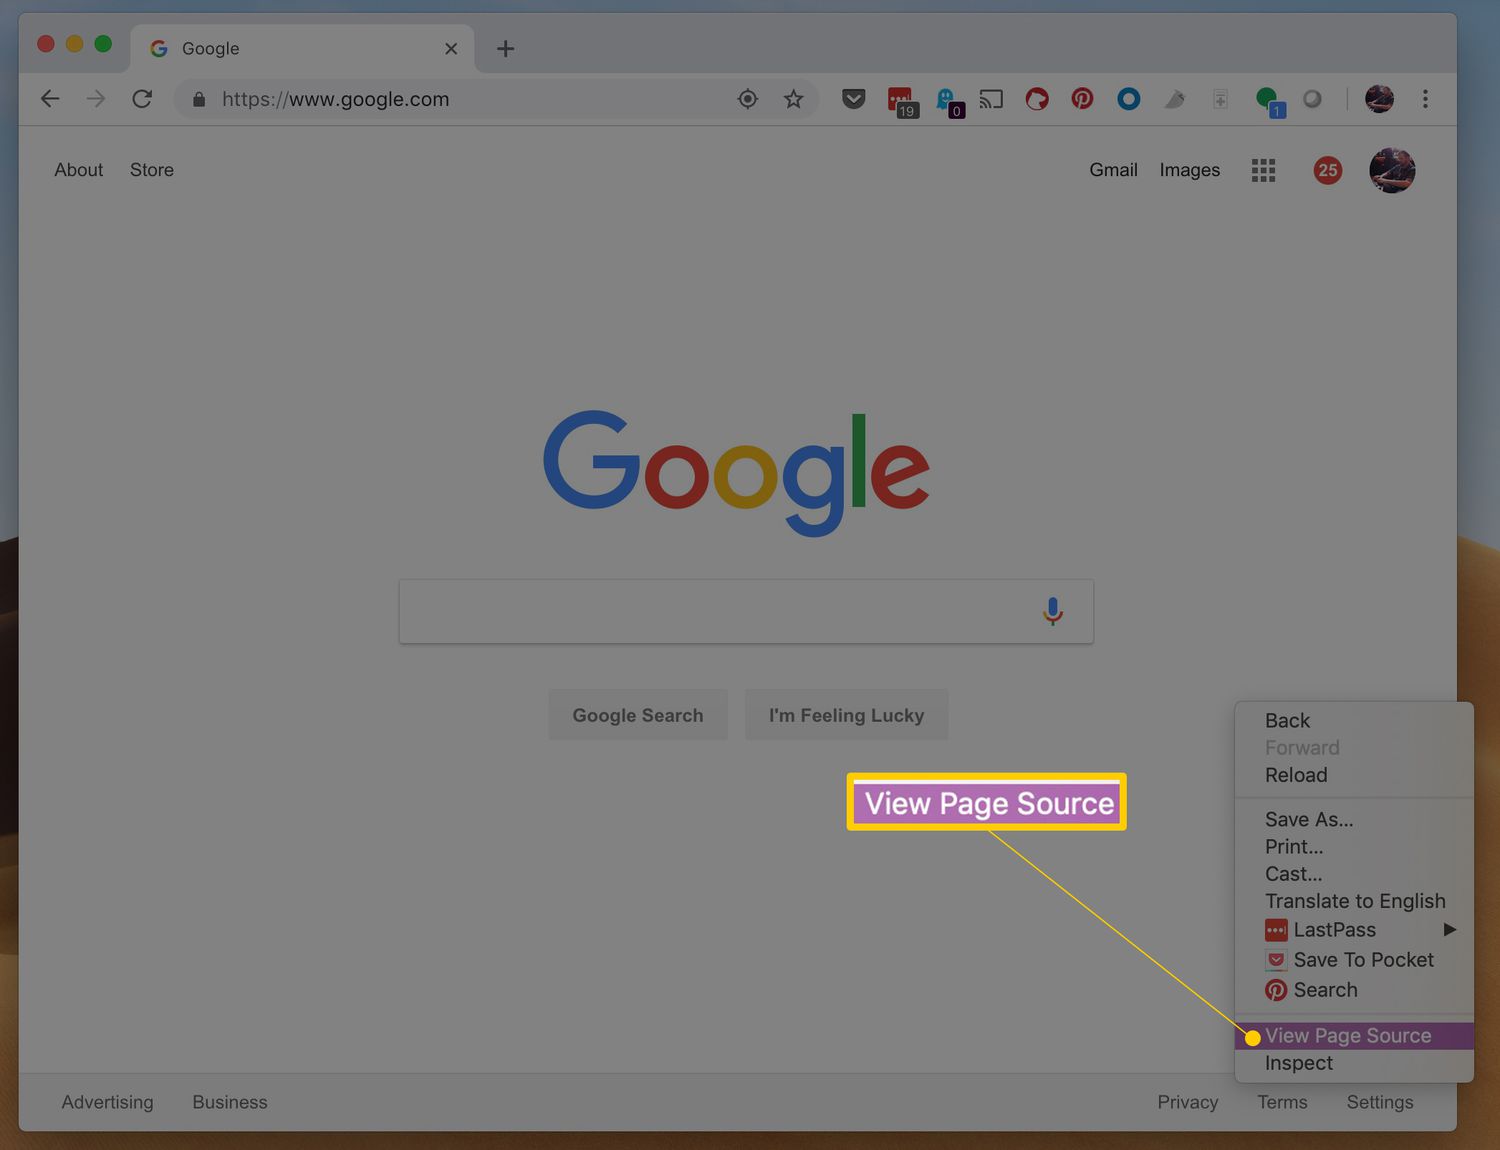
To utilize the "View Page Source" option, simply right-click anywhere on the webpage and select "View Page Source" from the context menu. Alternatively, you can use the keyboard shortcut by pressing "Ctrl + U" (Windows/Linux) or "Cmd + Option + U" (Mac). This action opens a new tab displaying the raw HTML source code of the webpage, presenting a textual representation of the elements, attributes, and content that compose the page.
Upon accessing the page source, you're greeted with a comprehensive view of the HTML markup that defines the webpage's structure. This textual representation unveils the building blocks of the webpage, including tags, attributes, and textual content. By analyzing the page source, you can gain a deeper understanding of how the webpage is constructed, the arrangement of its elements, and the inclusion of external resources such as scripts and stylesheets.
Furthermore, the "View Page Source" option facilitates the examination of metadata, such as meta tags and structured data markup, which play a crucial role in search engine optimization (SEO) and content indexing. By inspecting the page source, you can ensure the presence and correctness of essential metadata, thereby enhancing the webpage's visibility and relevance in search engine results.
In addition to serving as a valuable educational resource for understanding HTML structure and content, the "View Page Source" option enables you to identify and troubleshoot potential issues within the source code. Whether it's a missing closing tag, an improperly formatted attribute, or the absence of essential elements, the ability to scrutinize the raw HTML source empowers you to pinpoint and rectify discrepancies that may impact the webpage's functionality and presentation.
Moreover, the "View Page Source" option serves as a gateway to learning from the coding techniques employed by other developers. By examining the source code of well-crafted webpages, you can glean insights into best practices, efficient coding patterns, and innovative design implementations. This exposure to diverse coding styles and strategies can enrich your own development skills and inspire creative approaches to building compelling web experiences.
In essence, the "View Page Source" option in Google Chrome offers a window into the foundational elements of web development. It provides a means to dissect and comprehend the raw HTML structure of webpages, empowering you to gain insights, troubleshoot issues, optimize content, and derive inspiration from the coding craftsmanship of others. By embracing this feature, you embark on a journey of exploration and enlightenment, delving into the core language that shapes the digital landscape.


