Introduction
Debugging scripts in Firefox is an essential skill for developers seeking to identify and resolve issues within their code. Whether you're a seasoned developer or just starting out, understanding how to effectively debug scripts in Firefox can significantly streamline the troubleshooting process and enhance the overall quality of your code.
Firefox offers a robust set of developer tools that provide a comprehensive environment for debugging scripts. By leveraging these tools, developers can gain valuable insights into their code's behavior, identify errors, and efficiently pinpoint areas for improvement. This article will guide you through the process of setting up and utilizing the Firefox Developer Tools to debug scripts effectively.
By mastering the art of debugging in Firefox, you can expedite the development cycle, minimize the occurrence of bugs, and ultimately deliver more reliable and efficient code. Whether you're working on a personal project or collaborating within a team, the ability to debug scripts in Firefox is a valuable skill that can significantly impact the success of your development endeavors.
In the following sections, we will delve into the intricacies of setting up Firefox Developer Tools, utilizing the Debugger tool, employing breakpoints, inspecting variables, stepping through code, and handling errors and exceptions. Each of these aspects plays a crucial role in the debugging process, and by understanding and applying them effectively, you can elevate your proficiency in identifying and resolving script-related issues.
So, let's embark on this journey to unravel the power of Firefox Developer Tools and equip ourselves with the knowledge and techniques necessary to debug scripts with precision and confidence. Whether you're troubleshooting a complex web application or fine-tuning a simple script, the insights and strategies presented in this article will empower you to navigate the debugging process with ease and proficiency.
Setting Up Firefox Developer Tools
Setting up Firefox Developer Tools is the first step towards effectively debugging scripts within the Firefox browser. These tools provide a comprehensive suite of functionalities designed to empower developers in identifying and resolving issues within their code. To begin harnessing the power of Firefox Developer Tools, follow these steps:
-
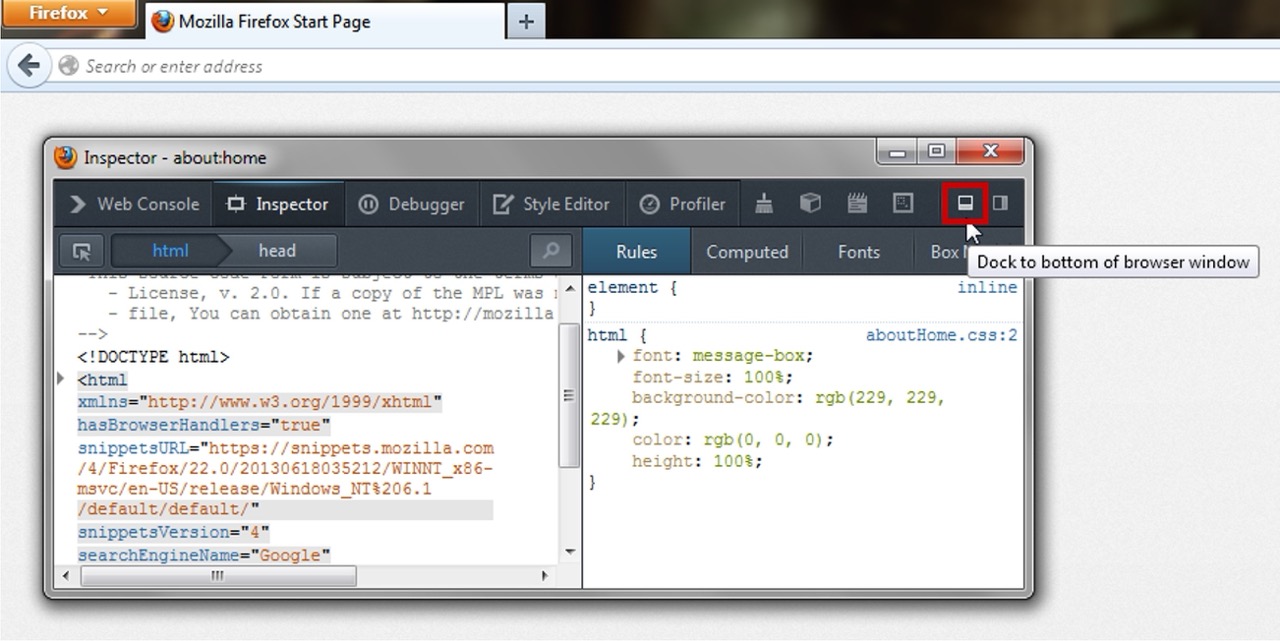
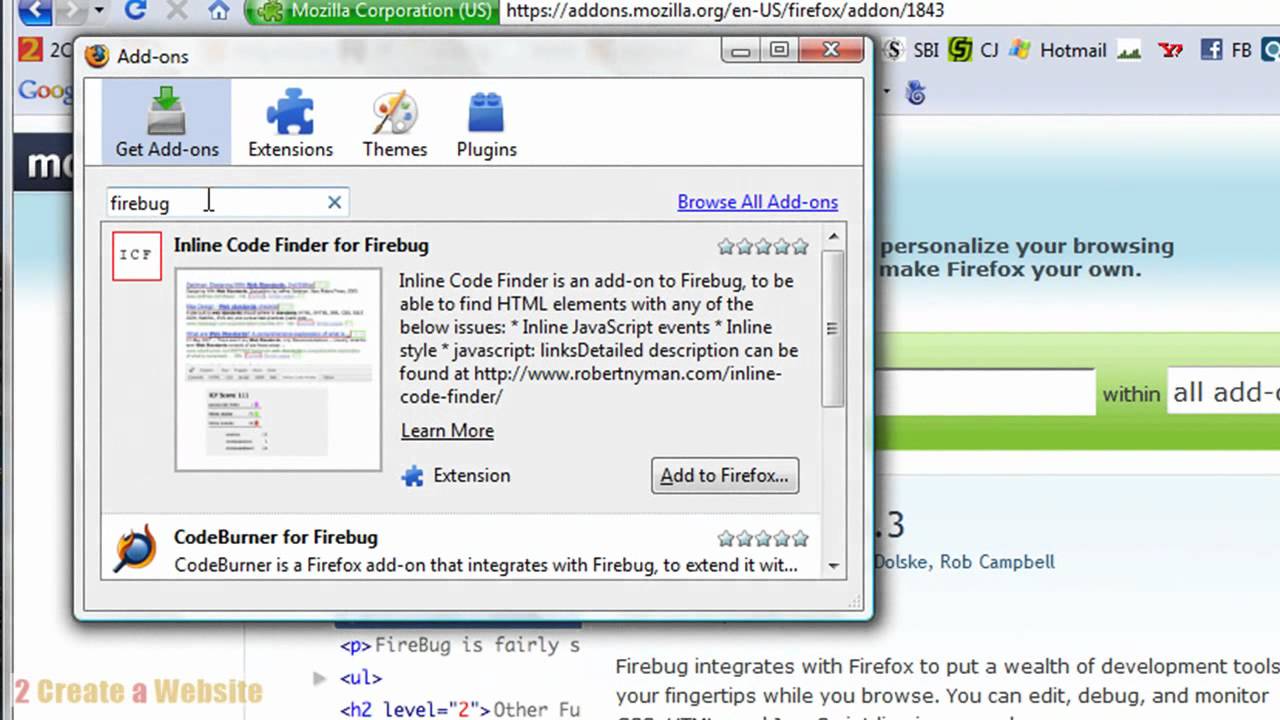
Accessing Developer Tools: Launch the Firefox browser and navigate to the webpage or application containing the script you intend to debug. Once on the desired page, right-click on an element within the page and select "Inspect Element" from the context menu. This action will open the Developer Tools panel, providing access to a range of debugging and inspection features.
-
Navigating to the Debugger: Within the Developer Tools panel, locate and click on the "Debugger" tab. This tab houses the primary tool for debugging scripts within Firefox. Upon selecting the Debugger tab, you will be presented with a clean and intuitive interface, equipped with various functionalities to aid in the debugging process.
-
Customizing the Workspace: Familiarize yourself with the layout and features of the Debugger tool. Firefox Developer Tools offer a customizable workspace, allowing you to arrange and resize panels to suit your preferences. Take a moment to explore the available options and tailor the workspace to optimize your debugging experience.
-
Enabling Additional Tools: Firefox Developer Tools encompass a multitude of functionalities beyond the Debugger tool. Explore the various tabs and panels within the Developer Tools interface to discover additional tools such as the Console, Network Monitor, and Performance tools. These supplementary features can provide valuable insights and aid in comprehensive script analysis.
-
Utilizing Keyboard Shortcuts: Firefox Developer Tools offer a range of keyboard shortcuts to streamline navigation and enhance productivity. Familiarize yourself with essential shortcuts for tasks such as stepping through code, setting breakpoints, and inspecting variables. Mastering these shortcuts can significantly expedite the debugging process.
By following these steps and acquainting yourself with the layout and functionalities of Firefox Developer Tools, you can establish a solid foundation for effectively debugging scripts within the Firefox browser. The seamless integration of these tools into the browser environment empowers developers to gain deep insights into their code and swiftly identify and address script-related issues. With the Developer Tools at your disposal, you are poised to embark on a journey of efficient and precise script debugging within the Firefox browser.
Using the Debugger Tool
The Debugger tool within Firefox Developer Tools serves as a cornerstone for effectively debugging scripts within the browser environment. This powerful tool provides developers with a comprehensive set of functionalities designed to facilitate script analysis, error identification, and code optimization. By leveraging the Debugger tool, developers can gain valuable insights into the behavior of their scripts and efficiently pinpoint areas for improvement.
Upon accessing the Debugger tab within Firefox Developer Tools, developers are presented with an intuitive interface that empowers them to delve into the intricacies of their scripts. The Debugger tool offers a range of features that streamline the debugging process, allowing developers to analyze script execution, identify errors, and gain a deeper understanding of their code's behavior.
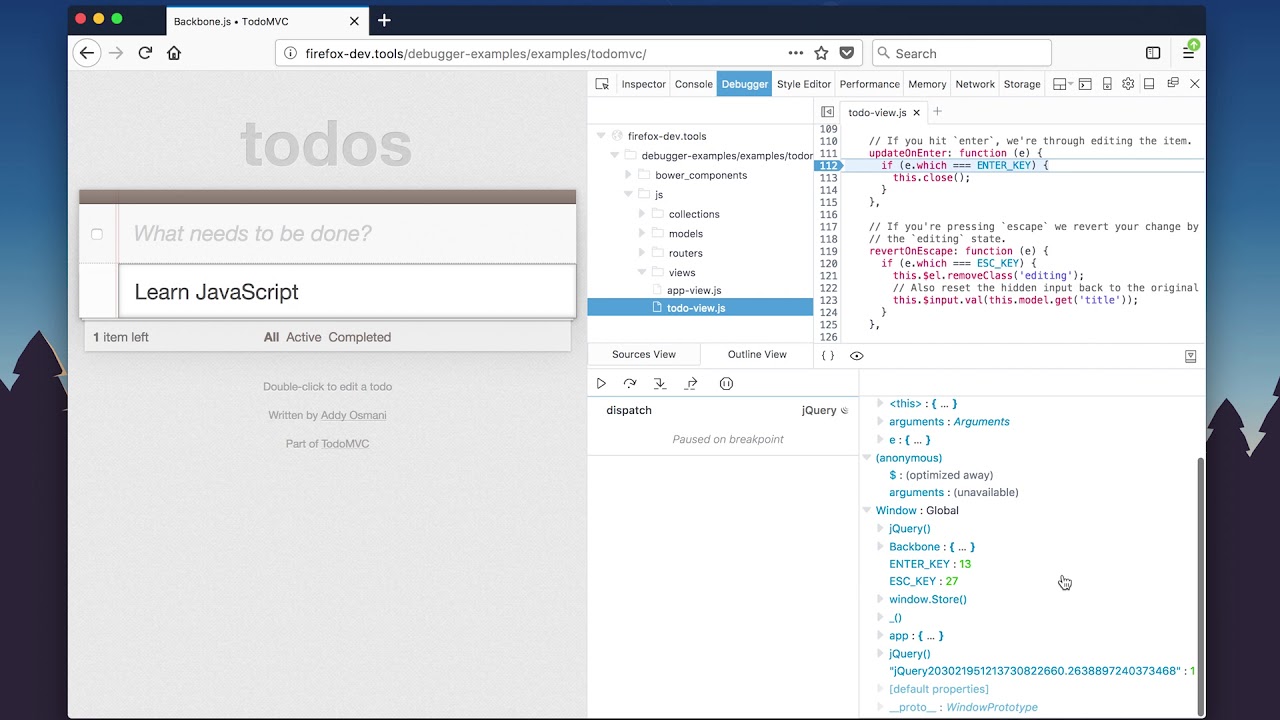
One of the key functionalities of the Debugger tool is the ability to set breakpoints within the script. By strategically placing breakpoints at specific lines of code, developers can pause script execution at critical junctures and inspect the state of variables, functions, and objects. This granular level of control enables developers to scrutinize the inner workings of their scripts and identify potential issues with precision.
Furthermore, the Debugger tool facilitates seamless navigation through script files, empowering developers to step through code and observe the execution flow. This capability is instrumental in understanding how the script behaves in different scenarios and pinpointing areas that may require optimization or error resolution.
The interface of the Debugger tool also provides a clear visualization of the call stack, allowing developers to track the sequence of function calls and understand the hierarchical structure of script execution. This feature is invaluable in diagnosing complex script behaviors and tracing the propagation of errors within the code.
Additionally, the Debugger tool offers comprehensive support for inspecting and modifying variables during script execution. Developers can effortlessly inspect the values of variables, set watch expressions to monitor specific variables, and modify variable values on the fly. This level of flexibility empowers developers to gain real-time insights into the state of their scripts and make informed decisions regarding variable manipulation.
In essence, the Debugger tool within Firefox Developer Tools equips developers with a robust set of functionalities to delve into the intricacies of their scripts, identify errors, and optimize code performance. By harnessing the capabilities of the Debugger tool, developers can elevate their proficiency in script debugging and embark on a journey of crafting more reliable and efficient code within the Firefox browser environment.
Using Breakpoints
Utilizing breakpoints is a fundamental technique in the art of script debugging, and within the Firefox Developer Tools, the Debugger tool offers a seamless and intuitive approach to setting and leveraging breakpoints. By strategically placing breakpoints within the script, developers can effectively pause script execution at specific points and gain valuable insights into the behavior of their code.
When setting breakpoints within the Debugger tool, developers can pinpoint critical junctures in their script where they intend to pause execution for closer inspection. This strategic placement allows developers to observe the state of variables, functions, and objects at precise moments, enabling them to identify potential issues and gain a deeper understanding of script behavior.
The process of setting breakpoints is straightforward and can be accomplished with precision within the Debugger tool interface. By simply clicking on the line number within the script file, developers can set a breakpoint, indicated by a distinct marker. Once the script is executed, the Debugger tool will pause execution at the specified breakpoint, providing developers with an opportunity to inspect the script's state and analyze its behavior.
Furthermore, the Debugger tool offers the flexibility to set conditional breakpoints, allowing developers to specify conditions under which the script execution should pause. This advanced feature empowers developers to tailor the debugging process to specific scenarios, enabling them to focus on critical conditions and streamline the identification of script-related issues.
By leveraging breakpoints within the Debugger tool, developers can gain a granular level of control over script execution, enabling them to scrutinize the inner workings of their code and identify potential issues with precision. This level of insight is instrumental in diagnosing complex script behaviors, optimizing code performance, and ultimately crafting more reliable and efficient scripts within the Firefox browser environment.
In essence, breakpoints serve as a powerful tool within the Debugger tool, empowering developers to pause script execution at strategic points and gain valuable insights into their code's behavior. By mastering the art of setting and utilizing breakpoints, developers can elevate their proficiency in script debugging and embark on a journey of crafting high-quality, robust scripts within the Firefox browser environment.
Inspecting Variables
Inspecting variables is a crucial aspect of script debugging, and within the Firefox Developer Tools, the Debugger tool offers a comprehensive set of functionalities to facilitate the inspection and analysis of variables during script execution. By gaining insights into the state and values of variables, developers can effectively diagnose issues, monitor script behavior, and make informed decisions regarding variable manipulation.
Upon pausing script execution at a breakpoint within the Debugger tool, developers can seamlessly inspect the values of variables within the script. The interface presents a clear visualization of the variables in scope, allowing developers to explore their values and gain a deeper understanding of their impact on script behavior. This level of visibility empowers developers to identify discrepancies, unexpected values, or uninitialized variables that may contribute to script-related issues.
Furthermore, the Debugger tool offers the capability to set watch expressions, enabling developers to monitor specific variables and receive real-time updates on their values as the script executes. This feature is invaluable in tracking the evolution of variable values and identifying patterns or anomalies that may require attention. By setting watch expressions, developers can gain a dynamic perspective on variable behavior and make informed decisions based on real-time insights.
In addition to inspecting variable values, the Debugger tool provides the flexibility to modify variable values during script execution. This functionality empowers developers to experiment with different variable values, test hypothetical scenarios, and assess the impact of variable manipulation on script behavior. By dynamically modifying variable values, developers can gain a deeper understanding of the script's behavior and explore potential solutions to script-related issues.
The interface of the Debugger tool offers a user-friendly environment for inspecting and interacting with variables, providing developers with a seamless experience in gaining insights into the state and behavior of variables within their scripts. This level of visibility and control over variables empowers developers to diagnose issues, optimize variable usage, and ultimately craft more reliable and efficient scripts within the Firefox browser environment.
In essence, inspecting variables within the Debugger tool equips developers with the tools and insights necessary to gain a comprehensive understanding of variable behavior during script execution. By leveraging the capabilities of the Debugger tool to inspect and interact with variables, developers can elevate their proficiency in script debugging and embark on a journey of crafting high-quality, robust scripts within the Firefox browser environment.
Stepping Through Code
Stepping through code is a fundamental technique in the process of script debugging, and within the Firefox Developer Tools, the Debugger tool offers a seamless and intuitive approach to navigating through script files and observing the execution flow. By leveraging the capabilities of the Debugger tool to step through code, developers can gain valuable insights into the behavior of their scripts, identify potential issues, and optimize code performance.
Upon pausing script execution at a breakpoint within the Debugger tool, developers can utilize the step functionality to navigate through the script's execution flow with precision. The step options, including "Step Over," "Step Into," and "Step Out," provide developers with granular control over the navigation process, enabling them to observe the sequence of function calls, method invocations, and variable assignments.
The "Step Over" functionality allows developers to advance to the next line of code in the current execution context, providing a high-level view of script behavior without delving into the details of function calls. This capability is instrumental in understanding the overarching flow of script execution and identifying potential areas for optimization or error resolution.
Conversely, the "Step Into" functionality enables developers to delve deeper into the execution flow by entering into function calls and method invocations. This granular level of navigation empowers developers to scrutinize the inner workings of functions, explore nested code structures, and gain insights into the behavior of specific code segments.
Additionally, the "Step Out" functionality allows developers to navigate out of the current function or method, providing a streamlined approach to observing the aftermath of specific code segments. This capability is invaluable in understanding the impact of function calls and method invocations on script behavior, enabling developers to identify potential issues or areas for optimization.
By leveraging the step functionality within the Debugger tool, developers can gain a comprehensive understanding of their script's execution flow, identify potential bottlenecks, and optimize code performance with precision. This level of control and visibility empowers developers to navigate through their scripts with confidence, gain valuable insights, and ultimately craft more reliable and efficient code within the Firefox browser environment.
In essence, stepping through code within the Debugger tool equips developers with the tools and insights necessary to gain a deep understanding of script execution flow. By mastering the art of navigating through code segments, developers can elevate their proficiency in script debugging and embark on a journey of crafting high-quality, robust scripts within the Firefox browser environment.
Handling Errors and Exceptions
Handling errors and exceptions is a critical aspect of script debugging, and within the Firefox Developer Tools, the Debugger tool offers a comprehensive set of functionalities to empower developers in effectively managing and resolving script-related issues. By mastering the art of handling errors and exceptions, developers can navigate the complexities of script debugging with confidence and precision.
When encountering errors or exceptions within a script, the Debugger tool provides developers with clear visibility into the nature of the issue, enabling them to pinpoint the root cause and devise appropriate solutions. The interface presents detailed error messages, stack traces, and contextual information, empowering developers to gain insights into the origin and impact of the error.
Upon encountering an error or exception, the Debugger tool seamlessly pauses script execution, providing developers with an opportunity to inspect the state of variables, functions, and objects at the point of error occurrence. This granular level of control enables developers to scrutinize the script's behavior and identify the factors contributing to the error, facilitating a targeted approach to issue resolution.
Furthermore, the Debugger tool offers robust support for stepping through the code surrounding the error, allowing developers to trace the sequence of operations leading up to the error occurrence. This capability is instrumental in understanding the context in which the error manifested, enabling developers to identify potential logic flaws, variable inconsistencies, or unexpected behaviors within the script.
In addition to visualizing the error context, the Debugger tool facilitates the exploration of error handling strategies, empowering developers to experiment with potential solutions and assess their impact on script behavior. By dynamically modifying code segments and evaluating alternative approaches, developers can iteratively refine their scripts and implement effective error mitigation strategies.
The interface of the Debugger tool also provides seamless integration with the Console, enabling developers to log custom messages, variable values, and diagnostic information to gain deeper insights into the script's behavior. This collaborative approach to error handling empowers developers to leverage a diverse set of debugging tools within the Firefox Developer Tools ecosystem.
In essence, handling errors and exceptions within the Debugger tool equips developers with the tools and insights necessary to navigate script-related issues with precision and confidence. By mastering the art of error and exception handling, developers can elevate their proficiency in script debugging and embark on a journey of crafting high-quality, robust scripts within the Firefox browser environment.
Conclusion
In conclusion, mastering the art of debugging scripts in Firefox is a transformative skill that empowers developers to navigate the complexities of script analysis, error identification, and code optimization with precision and confidence. The Firefox Developer Tools, particularly the Debugger tool, offer a robust environment for delving into the intricacies of script behavior, providing developers with a comprehensive suite of functionalities to streamline the debugging process.
By setting up Firefox Developer Tools and familiarizing oneself with the Debugger tool, developers can establish a solid foundation for effectively debugging scripts within the Firefox browser. The seamless integration of these tools into the browser environment empowers developers to gain deep insights into their code and swiftly identify and address script-related issues.
The process of setting up Firefox Developer Tools, utilizing the Debugger tool, employing breakpoints, inspecting variables, stepping through code, and handling errors and exceptions collectively equips developers with the knowledge and techniques necessary to elevate their proficiency in identifying and resolving script-related issues.
By strategically placing breakpoints within the script, developers can pause script execution at critical junctures and inspect the state of variables, functions, and objects. This granular level of control enables developers to scrutinize the inner workings of their scripts and identify potential issues with precision.
Furthermore, the capability to step through code and observe the execution flow empowers developers to understand how the script behaves in different scenarios and pinpoint areas that may require optimization or error resolution. The visualization of the call stack within the Debugger tool allows developers to track the sequence of function calls and understand the hierarchical structure of script execution, facilitating the diagnosis of complex script behaviors and the tracing of error propagation within the code.
Inspecting variables and handling errors and exceptions within the Debugger tool provide developers with the tools and insights necessary to gain a comprehensive understanding of variable behavior, manage script-related issues, and implement effective error mitigation strategies.
In essence, the insights and strategies presented in this article empower developers to navigate the debugging process with ease and proficiency, ultimately enabling them to craft more reliable and efficient code within the Firefox browser environment. By mastering the art of debugging scripts in Firefox, developers can expedite the development cycle, minimize the occurrence of bugs, and deliver high-quality, robust scripts that meet the demands of modern web development.