Importance of Point of Control in Trading
The Point of Control (POC) is a key concept in trading that holds great importance for traders. It is a price level at which the maximum volume of trades occurred during a given period. Understanding the significance of the Point of Control can provide valuable insights into market dynamics and help traders make informed trading decisions.
One of the primary reasons why the Point of Control is important is because it represents a level of significant market acceptance. It indicates a price level at which buyers and sellers have reached a consensus, leading to a high activity level. This level of market acceptance can act as a strong support or resistance level, where prices are more likely to reverse or consolidate.
Traders often use the Point of Control in conjunction with other technical indicators to validate their trading strategies. It helps them identify high probability trading opportunities and determine optimal entry and exit points. By analyzing the volume profile patterns and the location of the Point of Control, traders can gain insight into market sentiment and the strength of price levels.
Moreover, the Point of Control can also be used as a reliable reference point for risk management. Traders can set their stop-loss orders below the Point of Control when going long or above it when going short. This strategy allows traders to limit their losses and protect their positions in case the market goes against them.
Another benefit of using the Point of Control is its ability to provide traders with valuable information about potential market reversals. If the price is approaching the Point of Control and showing signs of rejection, such as strong selling or buying pressure, it could indicate a possible trend reversal. Traders can use this information to adjust their trading strategies and take advantage of potential trend changes.
Furthermore, the Point of Control is not limited to a specific timeframe. It can be applied to different timeframes, from short-term intraday trading to long-term position trading. This flexibility allows traders to adapt their strategies based on their preferred timeframes and trading styles.
In summary, the Point of Control plays a crucial role in trading as it represents a level of significant market acceptance and provides valuable insights into market dynamics. By incorporating the Point of Control into their trading strategies, traders can identify high probability trading setups, manage risks effectively, and capitalize on potential market reversals.
What is Point of Control?
The Point of Control (POC) is a technical indicator used in trading to identify the price level at which the highest volume of trades occurred during a specific period. It is a key component of Volume Profile analysis and provides valuable insights into market dynamics.
The calculation of the Point of Control is based on the concept of volume distribution. The Volume Profile chart displays the volume traded at different price levels, creating a histogram that represents the market’s activity. The Point of Control is determined by locating the price level with the highest peak on the histogram.
By identifying the Point of Control, traders can gain a better understanding of market sentiment. It represents an area where traders are actively participating in the market, indicating a level of significant market interest and acceptance. This price level often acts as a magnet, attracting prices back to it as buyers and sellers continue to trade at that level.
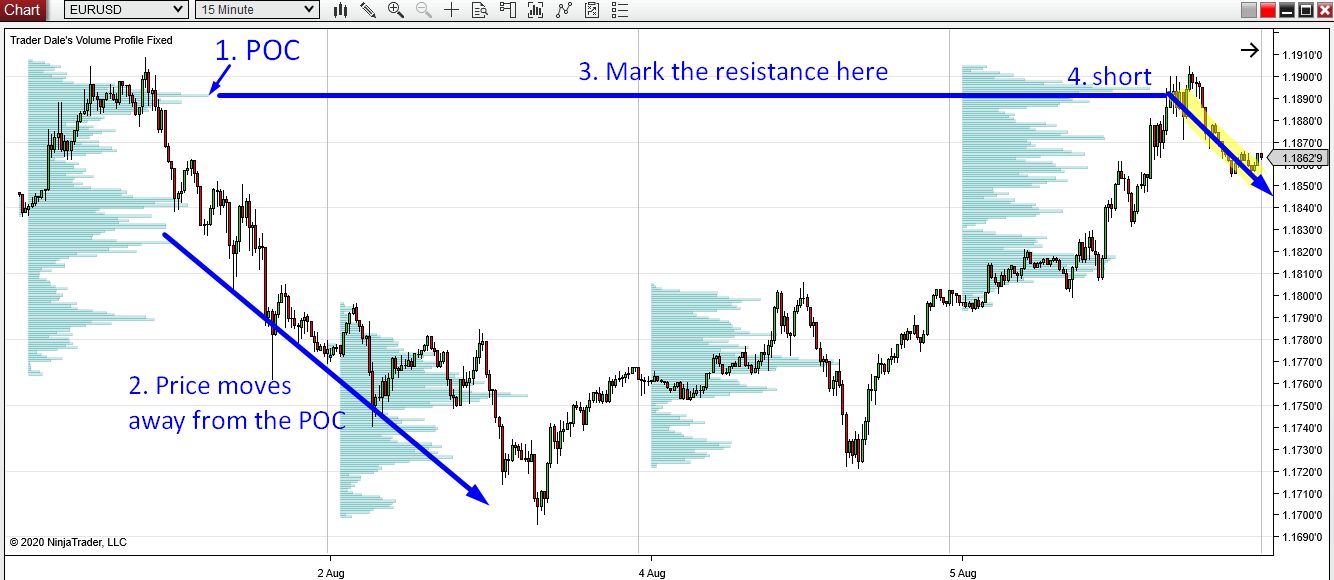
Understanding the Point of Control can help traders gauge market direction. If the price is moving away from the Point of Control, it suggests a potential shift in market sentiment and the possibility of a new trend forming. Conversely, if the price is repeatedly approaching and bouncing off the Point of Control, it indicates a strong level of support or resistance.
Furthermore, the Point of Control can be used in conjunction with other technical indicators to validate trading strategies. Traders may look for additional confirmation signals such as chart patterns, trendlines, or momentum oscillators before taking trades based on the Point of Control. This convergence of multiple indicators enhances the reliability of trading signals.
It is important to note that the Point of Control is not a fixed level but can change dynamically as new volume data becomes available. As the market evolves, the Point of Control may shift to reflect the changing dynamics of supply and demand. Traders should regularly review the Volume Profile and adjust their analysis accordingly.
In summary, the Point of Control is a vital indicator in trading that represents the price level with the highest volume of trades during a specific period. By understanding the Point of Control and its significance, traders can better interpret market sentiment, identify support and resistance levels, and validate their trading strategies. Incorporating the Point of Control into trading analysis can enhance trading decisions and increase the likelihood of successful trades.
How is Point of Control Calculated?
The calculation of the Point of Control (POC) is based on the concept of Volume Profile analysis, which provides a visual representation of the volume traded at different price levels. The POC is the price level at which the highest volume of trades occurs during a given period. Understanding how the Point of Control is calculated can help traders effectively analyze and interpret market data.
To calculate the Point of Control, traders need to analyze the Volume Profile chart, which displays the volume traded at various price levels. The Volume Profile creates a histogram that shows the distribution of volume across the price range. Each bar in the histogram represents a specific price level, and its height indicates the volume traded at that level.
The Point of Control is determined by identifying the price level with the highest peak on the Volume Profile histogram. This price level represents the area where the majority of trading activity occurred during the analyzed period. Traders can visually locate the Point of Control by looking for the tallest bar or the area with the highest concentration of volume on the chart.
In some trading platforms, the Point of Control may be automatically plotted on the Volume Profile chart, making it easier for traders to identify and analyze. However, in cases where it is not automatically displayed, traders can manually identify the Point of Control by visually inspecting the chart and identifying the price level with the highest volume peak.
It’s important to note that the calculation of the Point of Control is typically based on a specific time period, such as an individual trading session, day, week, or any other desired timeframe. Traders can adjust the period to analyze different market dynamics and timeframes to gain a deeper understanding of the market’s behavior.
Additionally, the Point of Control can be calculated for different instruments, such as stocks, commodities, or forex pairs, allowing traders to apply this concept across various markets and trading strategies.
In summary, the Point of Control is calculated by identifying the price level with the highest volume of trades on the Volume Profile chart. Traders can visually locate the Point of Control by looking for the tallest bar or the area with the highest concentration of volume. Understanding how the Point of Control is calculated helps traders interpret market data, identify key price levels, and make informed trading decisions.
Significance of Point of Control in Trading Strategy
The Point of Control (POC) holds significant importance in developing an effective trading strategy. It provides valuable insights into market dynamics and can be utilized in various ways to enhance decision-making and increase trading profitability.
One of the key significance of the Point of Control is its ability to act as a support or resistance level. As the price approaches the POC, it often experiences a reaction from buyers or sellers, leading to potential price reversals or consolidations. Traders can use the POC as a reference point to identify areas of interest where potential trading opportunities may arise.
Moreover, the POC serves as a key level of market acceptance. It indicates a price level where traders are actively participating and shows a consensus between buyers and sellers. This level of market acceptance can have a significant impact on price behavior and serve as a reliable reference for making trading decisions.
Another aspect of the significance of the POC lies in its ability to validate trading signals. Traders can cross-reference the POC with other technical indicators or patterns to confirm the strength of the signal. For example, if a bullish candlestick pattern forms near the POC, it can provide additional confirmation for a potential long trade setup.
Furthermore, the POC can be used as a tool for risk management. By placing stop-loss orders below the POC for long trades or above the POC for short trades, traders can effectively manage their risk and protect their capital. This technique allows for a controlled exit strategy if the market does not perform as expected.
Additionally, the POC can be utilized as a trend reversal indicator. If the price approaches the POC and shows signs of strong rejection, such as a sharp increase in trading volume or the formation of a reversal candlestick pattern, it can indicate a potential shift in market sentiment. Traders can adjust their trading strategies accordingly to take advantage of potential trend changes.
It is worth noting that the significance of the POC may vary depending on the timeframe being analyzed. In shorter timeframes, the POC can provide valuable intraday trading opportunities, while in longer timeframes, it can serve as a reference point for position trading strategies.
In summary, the Point of Control plays a crucial role in trading strategy development. Its significance lies in its ability to act as a support or resistance level, validate trading signals, manage risk, and indicate potential trend reversals. By incorporating the POC into their trading strategies, traders can make more informed decisions and increase the probability of successful trades.
Using Point of Control as Support and Resistance Levels
The Point of Control (POC) can be highly effective in identifying support and resistance levels in trading. By considering the POC as a key reference point, traders can enhance their analysis and make informed trading decisions.
As a support level, the POC indicates a price level where buyers are actively participating in the market and showing strong interest. The concentration of volume at this level suggests that many traders are willing to buy at or near the POC price. When the price approaches the POC from below, it often experiences a bounce or a slowdown in downward momentum, providing an opportunity for traders to enter long positions with the expectation of a price reversal.
Conversely, the POC can also act as a resistance level. When the price approaches the POC from above, it may encounter selling pressure as traders who bought at the POC look to exit their positions. This selling pressure can cause the price to retreat or consolidate, creating opportunities for traders to enter short positions or take profits from earlier long trades.
By using the POC as support and resistance levels, traders can set appropriate entry and exit points for their trades. For example, a trader anticipating a price reversal at the POC can set a buy order slightly above the POC as the price breaks through the resistance level, ensuring they enter the trade at a favorable price. Similarly, a trader looking to take profits near the POC as a resistance level can set a sell order slightly below the POC to secure their profit.
In addition to identifying specific entry and exit points, the POC can also provide traders with valuable insights into price action and price momentum. If the price approaches the POC and fails to break through it, it suggests a strong level of resistance or support. This information can be used to assess the strength of a trend and make decisions about whether to hold positions, take profits, or liquidate trades.
It is important for traders to consider other technical analysis tools and indicators in conjunction with the POC to confirm the support and resistance levels. This can include trendlines, moving averages, Fibonacci retracements, or candlestick patterns. The convergence of multiple indicators around the POC enhances its significance as a reliable support or resistance level.
When using the POC as support and resistance levels, traders should also closely monitor price action and volume patterns for any signs of breakouts or breakdowns from these levels. Such breakouts can indicate a shift in market sentiment and provide opportunities for traders to enter new positions or add to existing trades.
In summary, the Point of Control serves as a valuable tool for identifying support and resistance levels in trading. By considering the POC as a reference point, traders can set appropriate entry and exit points, assess price momentum, and make informed trading decisions. Incorporating the POC into technical analysis can enhance the probability of successful trades.
Point of Control and Volume Profile Trading
The Point of Control (POC) is a key component of Volume Profile trading, a technique that involves analyzing the volume traded at different price levels. Understanding the relationship between the POC and Volume Profile can provide traders with valuable insights and opportunities for effective trading strategies.
Volume Profile analysis allows traders to visualize the volume traded at specific price levels, generating a histogram that represents the market’s activity. The POC is the price level at which the highest volume of trades occurred during a given period, making it a significant reference point for traders.
In Volume Profile trading, the POC can be used to identify areas of high liquidity and market acceptance. It represents a level where traders have actively participated in the market, indicating a strong level of buying or selling interest. These areas of high liquidity can act as support or resistance levels, providing opportunities for traders to enter or exit trades.
Furthermore, traders can utilize the Volume Profile in combination with the POC to assess market sentiment and strength. A wider distribution of volume around the POC suggests greater market interest and stronger levels of support or resistance. Conversely, a narrower distribution of volume indicates lower market interest and weaker levels of support or resistance.
Volume Profile trading also involves analyzing the shape of the volume histogram. Traders look for patterns such as single peaks, double peaks, or bell-shaped distributions, which can provide further insights into price levels and potential market behavior. The POC within these patterns can help traders determine the significance of certain price levels and make informed trading decisions.
Moreover, the POC can aid traders in identifying areas of accumulation or distribution within the market. If the price is consistently drawn towards the POC, it suggests a strong level of interest and potential accumulation. Conversely, if the price repeatedly bounces off the POC, it could indicate distribution or selling pressure in the market.
Traders can also utilize the Volume Profile in conjunction with other technical indicators to validate trading setups. For example, if a bullish reversal candlestick pattern forms near the POC, it can provide confirmation for a potential long trade.
It is worth noting that the POC and Volume Profile analysis can be applied across various timeframes, enabling traders to adapt their strategies based on their preferred trading style and investment horizon. Short-term traders can take advantage of intraday POC levels, while long-term investors can consider POC levels on weekly or monthly charts.
In summary, the POC is a crucial component of Volume Profile trading, providing traders with valuable insights into market sentiment and liquidity. By analyzing the Volume Profile and the POC, traders can identify significant price levels, assess market strength, and make well-informed trading decisions. Incorporating Volume Profile analysis into trading strategies can enhance the probability of successful trades and improve overall trading performance.
Point of Control in Different Timeframes
The Point of Control (POC) is a versatile technical indicator that can be used across different timeframes in trading analysis. By analyzing the POC in various timeframes, traders can gain valuable insights into market dynamics and customize their trading strategies accordingly.
In short-term intraday trading, the POC can help traders identify significant levels of support and resistance within the trading session. By analyzing the POC on a 5-minute or 15-minute chart, traders can better understand where the highest trading volume is concentrated during that specific timeframe. This can provide valuable information about potential turning points or areas of consolidation within the intraday market.
On a daily timeframe, the POC can serve as a powerful reference point for swing trading strategies. By analyzing the POC over multiple days or weeks, traders can gain insights into the areas where the highest accumulation or distribution of volume has occurred. This can help traders identify key support and resistance levels and make more informed decisions about entry and exit points in their swing trades.
For longer-term position traders, the POC on weekly or monthly charts can play a significant role in identifying major market turning points and long-term trend reversals. By analyzing the POC over an extended period, traders can identify the levels where sustained buying or selling activity has taken place. These levels can act as strong support or resistance zones and provide valuable guidance for position sizing and long-term trade management.
It’s important to note that the significance of the POC may vary depending on the trading timeframe and the specific market being analyzed. Traders should consider the context of the market and the time horizon of their trades to make appropriate decisions when incorporating the POC into their analysis.
Additionally, traders can also use multiple timeframes in their analysis to validate the importance of the POC across different time horizons. If the POC aligns on multiple timeframes, it strengthens the significance of that level and increases traders’ confidence in its potential as a support or resistance level.
While the POC provides valuable insights in different timeframes, it is important for traders to combine the analysis of the POC with other technical indicators, such as trend lines, moving averages, or Fibonacci levels, to develop a comprehensive trading strategy. This holistic approach ensures that traders consider multiple factors when making trading decisions.
In summary, the Point of Control can be effectively applied in various timeframes for trading analysis. By examining the POC in different time horizons, traders can identify significant support and resistance levels, make informed trading decisions, and tailor their strategies to the specific timeframe they are trading. Incorporating the POC into multi-timeframe analysis enhances the overall effectiveness of trading strategies and improves the probability of successful trades.
Strategies for Trading with Point of Control
Trading with the Point of Control (POC) can be a powerful approach to technical analysis. By incorporating the POC into trading strategies, traders can capitalize on the significance of this indicator and increase the probability of successful trades. Below are some strategies for trading with the POC:
1. POC Breakout Strategy: Traders can look for breakouts above or below the POC level as a signal for potential trend continuation or reversal. When the price breaks above the POC, it may indicate a bullish signal and provide an opportunity to enter long trades. Conversely, when the price breaks below the POC, it may suggest a bearish signal and provide a chance to enter short trades.
2. POC Pullback Strategy: Traders can take advantage of pullbacks to the POC as potential entry points. After a breakout or strong move away from the POC, the price often retraces back towards the POC before continuing in the direction of the initial move. Traders can identify these pullbacks and enter trades at favorable prices, riding the momentum of the overall trend.
3. POC Reversal Strategy: A significant POC level can act as a reversal point where the price reverses its direction. Traders can watch for price action signals, such as rejection candles or divergences, near the POC for potential reversal trades. Combining these signals with the confluence of other technical indicators can help increase the reliability of the trade setup.
4. POC as Support/Resistance Strategy: The POC can be used as a reference point to identify levels of support and resistance. Traders can anticipate price reactions at the POC, such as bounces or consolidations. By placing trades near these levels, they can take advantage of potential price reversals or continuations.
5. POC and Volume Confirmation Strategy: Traders can validate the significance of the POC by looking for confirmation signals from volume. A higher trading volume near the POC can provide additional confirmation for potential trades. Increasing volume during a breakout or decreasing volume during a pullback can strengthen the validity of the trade setup.
6. POC in Combination with Other Indicators: Traders can combine the analysis of the POC with other technical indicators, such as moving averages, trendlines, or oscillators, for a more comprehensive trading strategy. The convergence of multiple indicators with the POC can enhance the probability of successful trades and provide confirmation for potential trade setups.
It is important for traders to adapt these strategies to their own trading style and preferences. They should also consider risk management techniques, such as placing stop-loss orders below support levels or above resistance levels, to protect their positions in case the market moves against their trades.
By incorporating these strategies into their trading approach, traders can leverage the power of the POC and increase their chances of successful trades. However, it is essential to practice proper risk management and continuously monitor the market for any changes or new information that may impact trade positions.
Examples of Trading Setups Using Point of Control
The Point of Control (POC) can be effectively used in various trading setups to identify potential trade opportunities. Here are a few examples of trading setups using the POC:
1. POC Breakout Setup: In this setup, traders identify a strong POC level and wait for a breakout above or below it. For example, if the price breaks above the POC level with increasing volume, it could indicate a bullish breakout. Traders can enter long positions with a stop-loss below the breakout level and target a higher price level, aiming to ride the trend.
2. POC Pullback Setup: After a significant price move away from the POC, the price often pulls back towards the POC before resuming the trend. Traders can wait for the pullback to the POC level and look for signs of price reversal or consolidation. Once the price shows signs of support or bullish momentum near the POC, traders can enter long positions with a stop-loss below the pullback low and target the recent high or the next resistance level.
3. POC Rejection Setup: In this setup, traders look for price rejections near the POC level. If the price approaches the POC and fails to break through or shows signs of strong rejection, such as a bearish engulfing candlestick pattern or a sudden increase in selling volume, it can indicate a potential reversal. Traders can enter short positions with a stop-loss above the rejection high and aim for lower support levels or the next downside target.
4. POC as Support/Resistance Setup: The POC can act as a key support or resistance level. Traders can look for price reactions near the POC to identify potential trade setups. For example, if the price bounces off the POC and forms a bullish reversal candlestick pattern, it can signal a buying opportunity. Traders can enter long positions with a stop-loss below the support level provided by the POC and aim for the next resistance level or a target based on other technical factors.
5. POC Confirmation Setup: Traders can use the POC in combination with other technical indicators to validate trading signals. For instance, if the price approaches the POC, and at the same time, a bullish divergence forms on an oscillator or a trendline breakout occurs, it can strengthen the bullish bias. Traders can enter long positions with a stop-loss based on the supporting indicator and target higher levels based on the overall market context.
These are just a few examples of trading setups using the POC. Traders should adapt these setups to match their own trading style, risk tolerance, and timeframe preferences. It’s important to combine the analysis of the POC with other technical analysis tools and indicators to increase the probability of successful trades and manage risk effectively.
Furthermore, traders should always practice proper risk management techniques, including setting stop-loss orders and adjusting position sizes according to their risk tolerance and overall market conditions.
By applying these trading setups using the POC, traders can take advantage of the insights provided by this key indicator and make more informed trading decisions.
Conclusion
The Point of Control (POC) is a powerful tool in trading that holds significant importance in analyzing market dynamics and making informed trading decisions. By understanding the concept of the POC and its calculation, traders can utilize this indicator to identify support and resistance levels, validate trading setups, and manage risk effectively.
The POC represents a price level at which the highest volume of trades occurred during a specific period. It is a level of significant market acceptance, indicating a consensus between buyers and sellers. This level can act as a strong support or resistance level, guiding traders in determining optimal entry and exit points.
Traders can incorporate the POC into various trading strategies, such as breakout strategies, pullback strategies, reversal strategies, and using it as a support or resistance reference point. By combining the analysis of the POC with other technical indicators and patterns, traders can enhance the reliability of their trading signals and increase the probability of successful trades.
Furthermore, the POC can be utilized in different timeframes, allowing traders to adapt their strategies based on their preferred trading styles and time horizons. Whether in intraday trading, swing trading, or position trading, the POC can provide valuable insights into market sentiment and price levels.
It is important for traders to practice proper risk management techniques when using the POC in their trading strategies. This includes setting stop-loss orders, adjusting position sizes, and considering the overall market context and risk appetite.
In conclusion, the Point of Control is an essential tool in trading analysis. By understanding its significance, calculating it accurately, and applying it effectively, traders can leverage the power of the POC to make well-informed trading decisions and increase their chances of success in the markets.