Introduction
Java Virtual Machine (JVM) is a crucial component of the Java Runtime Environment (JRE) that allows Java applications to run on different platforms. It acts as an intermediary between the Java bytecode and the underlying operating system, providing a platform-independent execution environment.
JVM plays a vital role in ensuring the performance, security, and portability of Java applications. However, as with any software, it is not immune to issues and errors. Understanding how to diagnose and fix JVM problems is essential for maintaining the stability and smooth operation of Java-based applications.
In this article, we will explore common JVM issues and discuss various techniques to fix them. From dealing with JVM crashes and memory issues to optimizing JVM performance, we will provide practical tips to get your Java applications up and running smoothly again.
Whether you are a developer, system administrator, or someone troubleshooting Java-related problems, this guide will serve as a comprehensive resource to help you overcome JVM errors and keep your applications running at their best.
What is Java Virtual Machine?
To understand how to fix JVM issues, it is important to have a basic understanding of what Java Virtual Machine (JVM) is and how it works. JVM is an integral part of the Java platform and serves as the runtime environment for Java applications.
At its core, JVM is a virtual machine that executes Java bytecode – a compiled form of Java source code. It provides an abstraction layer between the Java application and the underlying hardware and operating system. This abstraction allows Java programs to be platform-independent, meaning they can run on any operating system or architecture that has a compatible JVM implementation.
JVM consists of several components, including the class loader, bytecode verifier, interpreter, and Just-In-Time (JIT) compiler. Let’s take a brief look at each of these components to understand their roles in the execution process:
- Class Loader: The class loader is responsible for loading the Java class files into the JVM’s memory. It searches for the required classes in the classpath and loads them as needed.
- Bytecode Verifier: The bytecode verifier ensures the integrity and security of the Java bytecode before it is executed. It checks for any violations of the Java Virtual Machine Specification to prevent potential errors and security vulnerabilities.
- Interpreter: The interpreter reads and executes the bytecode instructions line by line. It converts each bytecode instruction into the corresponding native machine instructions and performs the desired operations.
- JIT Compiler: The JIT compiler dynamically analyzes the code being executed and identifies hotspots, which are frequently executed code segments. It then compiles these hotspots into native machine code for faster execution.
The JVM provides a range of built-in capabilities, including memory management, garbage collection, and thread management, to handle the execution of Java applications efficiently. Its ability to abstract the underlying hardware and operating system details makes Java a highly versatile and portable programming language.
By understanding the fundamental workings of the JVM, we can delve deeper into resolving JVM issues and optimizing its performance to ensure the smooth operation of Java applications.
Common JVM Issues
While Java Virtual Machine (JVM) provides a robust runtime environment for Java applications, it is not immune to issues and errors. Understanding the common JVM issues can help you diagnose and resolve problems effectively. Let’s take a look at some of the common issues you may encounter when working with JVM:
- Memory Issues: JVM manages memory allocation for Java applications. Out of memory errors, such as “Java heap space” or “GC overhead limit exceeded,” are common indications of memory-related problems. These issues can occur when the application consumes excessive memory or when there is a memory leak.
- Crashes and Fatal Errors: JVM crashes or fatal errors can occur due to various reasons, such as incompatible native libraries, incorrect JVM configuration, or hardware problems. These crashes can cause the application to terminate abruptly and may lead to data loss or system instability.
- Performance Bottlenecks: Inefficient code, suboptimal JVM settings, or resource constraints can result in poor performance. Slow execution, high CPU usage, or excessive garbage collection activity are indicators of performance bottlenecks.
- Concurrency and Thread Issues: Java’s multi-threaded nature can lead to synchronization issues, deadlock situations, or race conditions. These issues can cause application hangs or incorrect behavior when multiple threads access shared resources simultaneously.
- Version Compatibility: Using an incompatible version of the JVM or mixing different versions of Java libraries can lead to compatibility issues. This can result in unexpected behavior, class loading errors, or unhandled exceptions.
Being aware of these common issues and their symptoms is crucial when troubleshooting JVM-related problems. The next sections will guide you through the process of fixing and preventing these issues to ensure the smooth operation of your Java applications.
How to Fix a JVM Crash
A JVM crash can occur due to various reasons, including incompatible native libraries, JVM configuration issues, or hardware problems. When faced with a JVM crash, follow these steps to diagnose and resolve the issue:
- Collect Crash Logs: JVM generates crash logs that can provide valuable information about the cause of the crash. Look for files with “.hs_err_pid” extension in the application’s directory or the system’s temporary directory. Analyze the logs to identify any specific error messages or stack traces.
- Check JVM Version: Ensure that you are using a stable and up-to-date version of the JVM. Older versions may contain known issues that have been addressed in newer releases. Consider updating to the latest stable version of the JVM and repeat the steps to reproduce the crash.
- Review Native Libraries: Incompatible or corrupted native libraries can cause JVM crashes. Check if any recently added native libraries are incompatible with the JVM version or platform. Verify the integrity of the native library files and replace them if necessary.
- Adjust JVM Configuration: Review the JVM configuration settings, such as heap size (-Xmx), garbage collector options (-XX:+UseParallelGC), or thread settings. Consider increasing the maximum heap size or tweaking other relevant settings to optimize performance and stability.
- Analyze Application Code: Examine your application’s code for any potential issues that could lead to a JVM crash. Look for unsafe calls, memory leaks, or incorrect resource management. Use appropriate debugging and profiling tools to identify any problematic areas in the code.
- Update Dependencies: Ensure that all dependencies and libraries used by your application are compatible with the JVM and other application components. Update any outdated or incompatible dependencies to the latest stable versions to avoid compatibility issues that could trigger JVM crashes.
- Contact JVM Support: If the JVM crash persists despite your attempts to resolve it, consider contacting the JVM vendor or developer support. They may provide you with additional insights or guidance on resolving the issue.
By following these steps, you can diagnose the cause of JVM crashes and take appropriate measures to fix the issue. It is important to note that fixing JVM crashes can be a complex process, and sometimes it may require the assistance of experienced professionals or support from JVM vendors.
Fixing JVM Memory Issues
Memory-related issues are common in Java applications and can lead to performance degradation or even application crashes. To address JVM memory issues, consider implementing the following techniques:
- Adjust Heap Size: One of the primary causes of memory issues is insufficient heap space. Increase the maximum heap size (-Xmx) to allow the JVM to allocate more memory for the application. Monitor the application’s memory usage and adjust the heap size accordingly to find the optimal balance between performance and memory consumption.
- Optimize Garbage Collection: Configure the garbage collector (GC) to minimize memory usage and improve performance. Experiment with different garbage collection algorithms (e.g., Serial, Parallel, or CMS) and tune GC options (-XX:+UseParNewGC, -XX:+UseConcMarkSweepGC) based on your application’s requirements and characteristics.
- Identify Memory Leaks: Memory leaks can gradually exhaust available memory and cause out-of-memory errors. Use memory profilers or monitoring tools to identify potential memory leaks in your application. Once identified, refactor the code to fix the leaks and ensure proper memory deallocation.
- Release Unused Resources: Ensure that resources such as database connections, file handles, or network sockets are properly closed and released when they are no longer required. Failing to release these resources can lead to resource leaks and unnecessary memory consumption.
- Use Efficient Data Structures: Use appropriate data structures that minimize memory usage. For example, consider using the StringBuilder class instead of concatenating strings using the ‘+’ operator, as it creates fewer intermediate objects and reduces memory overhead.
- Implement Object Pooling: For frequently created and discarded objects, consider implementing object pooling. Object pooling reuses existing objects instead of creating new ones, reducing memory allocation and garbage collection overhead.
- Implement Lazy Loading: When dealing with large datasets or resource-intensive operations, implement lazy loading techniques to load data or resources on-demand instead of loading everything upfront. This approach conserves memory by loading only what is required at a given moment.
By implementing these techniques, you can effectively manage JVM memory and optimize your application’s performance. Remember to monitor memory usage regularly and fine-tune the memory settings based on your application’s specific requirements and workload.
Debugging JVM Errors
When encountering JVM errors, it is crucial to identify and resolve them promptly to ensure the stability and reliability of your Java applications. Here are some steps you can take to debug JVM errors effectively:
- Review Error Messages: JVM errors typically generate error messages or stack traces that provide valuable information about the cause of the error. Start by carefully examining these error messages to gain insights into the nature of the problem.
- Enable JVM Debugging Options: Enable JVM debug options to gather additional information during the error occurrence. For example, you can enable verbose output (-verbose) or enable JVM debugging (-Xdebug) to capture detailed information about the error.
- Reproduce the Error: Attempt to reproduce the error consistently by identifying the steps or conditions that trigger the issue. Understanding the patterns associated with the error occurrence can help narrow down the potential root causes.
- Use Debugging and Profiling Tools: Utilize debugging and profiling tools to analyze and understand the application’s behavior during the error. Tools such as debuggers, profilers, or performance monitoring tools can provide insights into memory usage, thread activity, and code execution flow.
- Analyze Log Files: Log files can be a valuable source of information when debugging JVM errors. Analyze application logs, JVM logs, or any other relevant logs to identify any patterns or anomalies that could aid in diagnosing and fixing the error.
- Isolate and Test Components: If possible, isolate the problematic component or section of code and conduct targeted testing to identify the specific cause of the error. This can involve disabling or gradually reintroducing parts of the code or components to isolate the error-causing section.
- Consult Developer Communities and Documentation: Seek assistance from developer communities, forums, or official documentation specific to the JVM or the technologies you are using. Other developers may have encountered similar issues and may have insights or solutions to help you troubleshoot the error.
Debugging JVM errors can be a challenging task, especially when they are sporadic or have complex root causes. Persistence, attention to detail, and a systematic approach are key when troubleshooting and resolving JVM errors. Additionally, it is crucial to keep your JVM and related tools up to date to leverage bug fixes and improvements that can address known issues.
Updating and Reinstalling Java Runtime Environment (JRE)
Updating and reinstalling the Java Runtime Environment (JRE) is a common troubleshooting step when dealing with Java-related issues. Outdated or corrupted JRE installations can cause compatibility problems, security vulnerabilities, or performance issues in your Java applications. Here are the steps to update or reinstall the JRE:
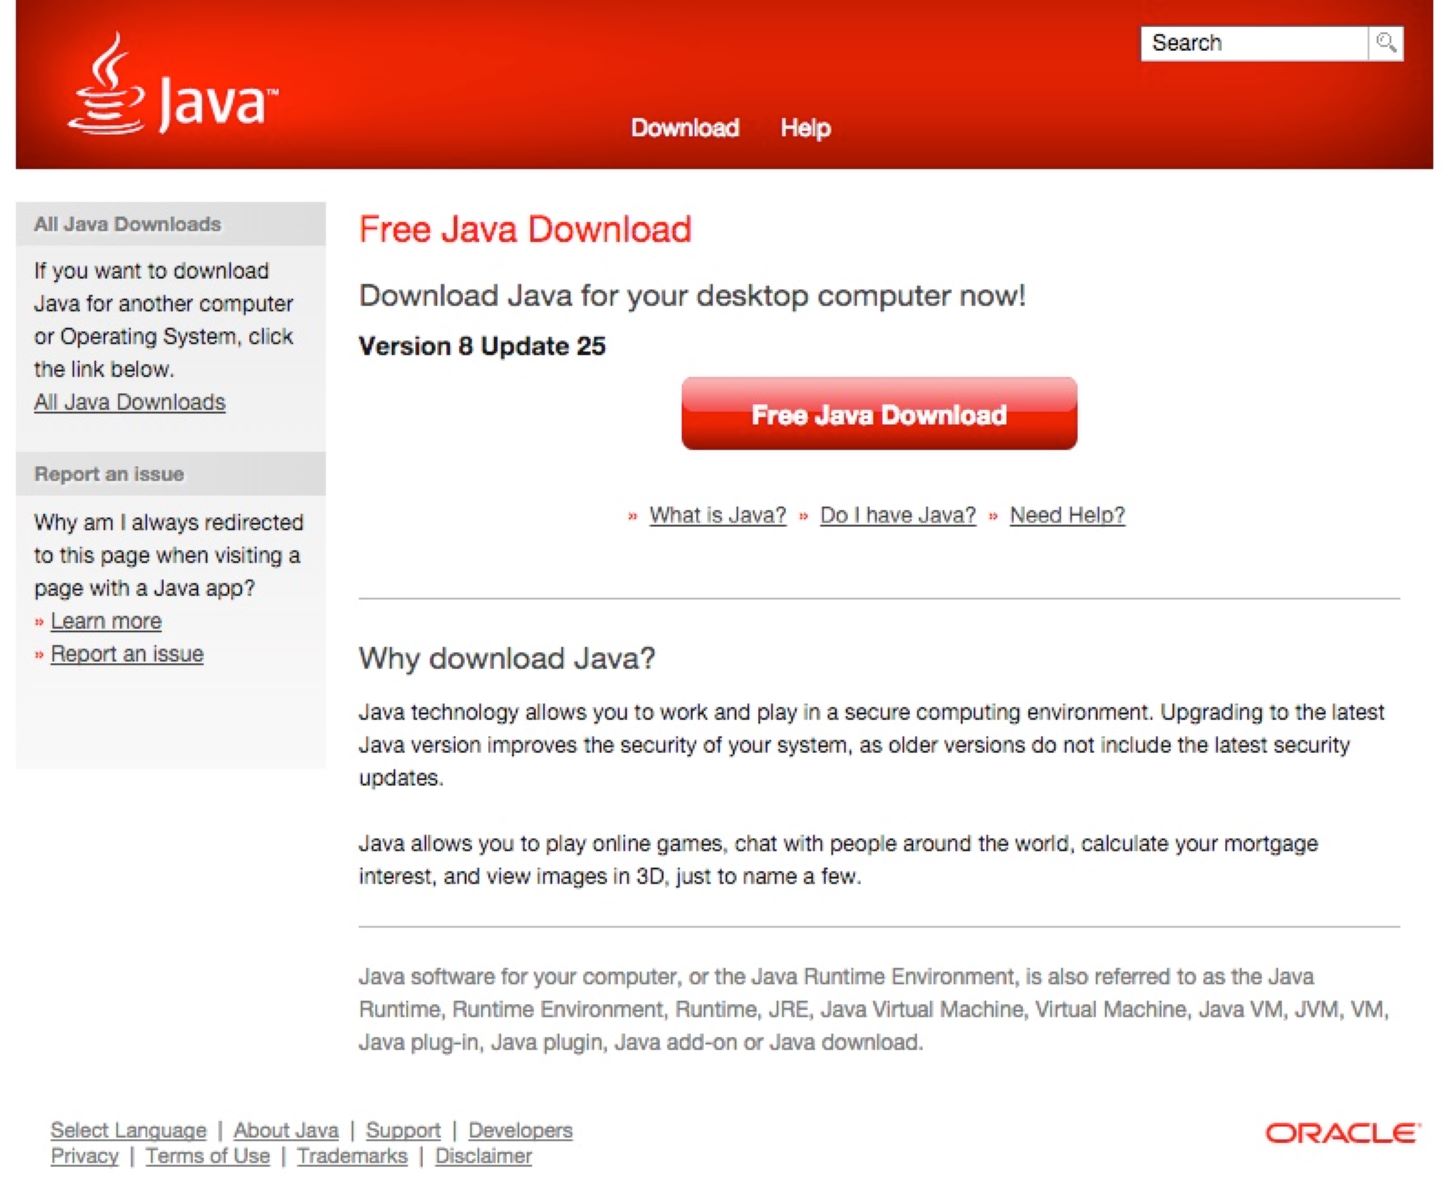
- Check Current JRE Version: Determine the currently installed JRE version by running the “java -version” command in the command prompt or terminal. Compare this version with the latest available version on the official Oracle Java website.
- Download the Latest JRE: Visit the official Oracle Java website and download the latest version of the JRE that matches your operating system and CPU architecture. Ensure that you download the appropriate version for your system (32-bit or 64-bit).
- Uninstall Existing JRE: Before reinstalling the JRE, it is recommended to uninstall the existing version to avoid potential conflicts. On Windows, go to the Control Panel > Programs > Uninstall a Program, locate the JRE installation, and select “Uninstall.” On macOS, locate the JRE installation file in the Applications folder and move it to the Trash.
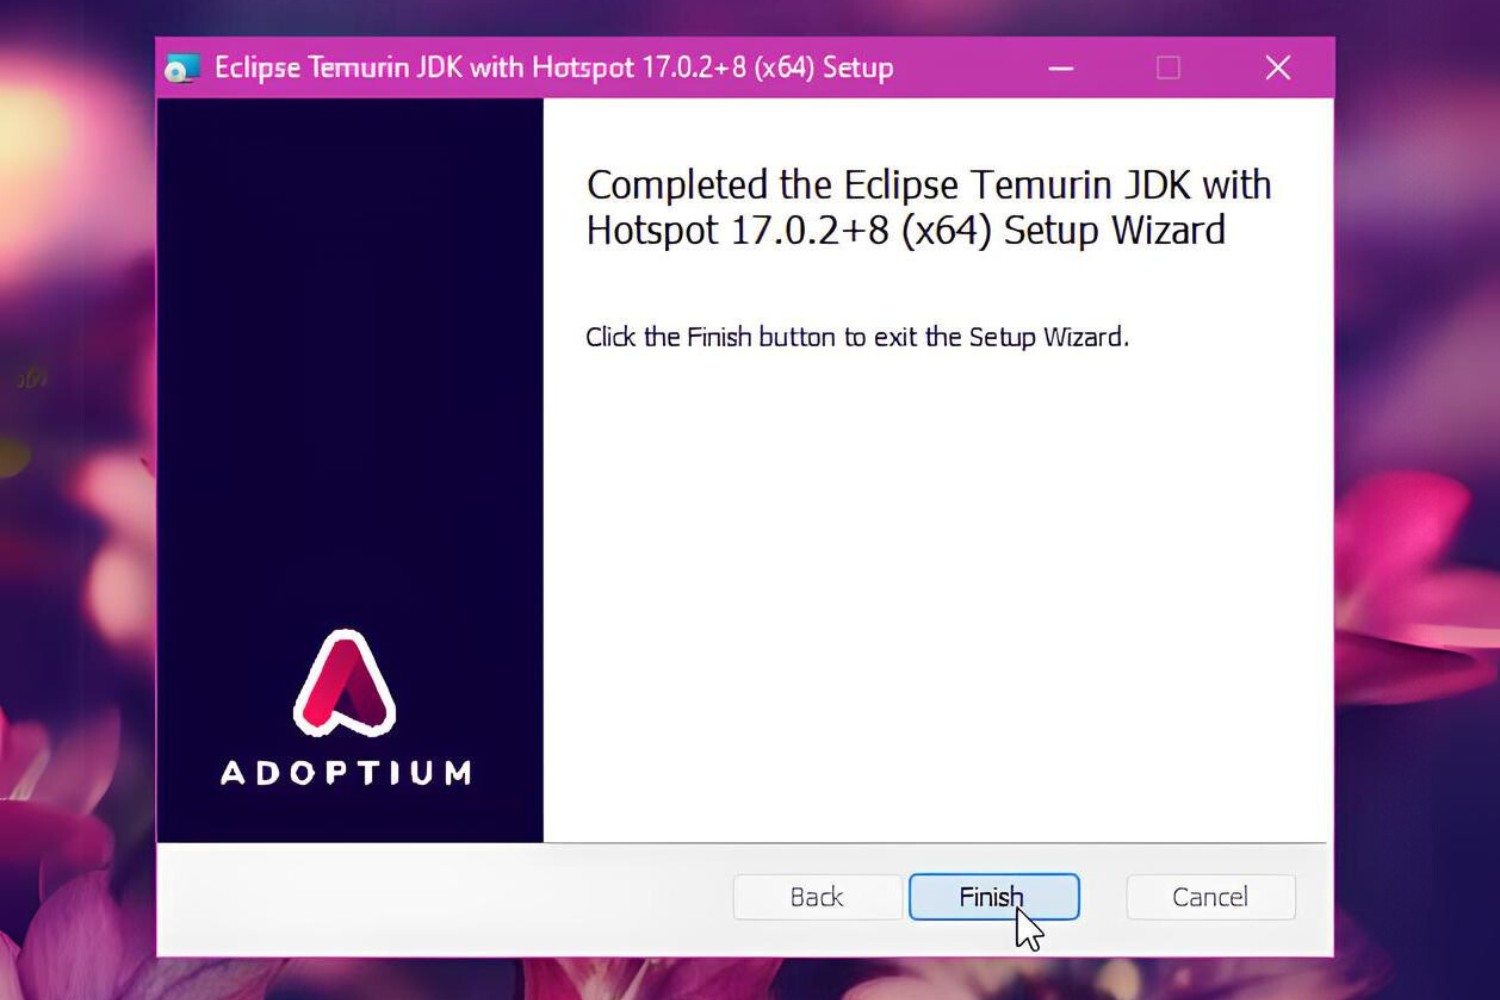
- Install the Latest JRE: Run the JRE installation file that you downloaded earlier and follow the on-screen instructions to install the latest version of the JRE. During installation, ensure that you select the desired configuration options, such as browser plugins or environment variables.
- Verify JRE Installation: After installation, verify that the new JRE version is correctly installed by running the “java -version” command again in the command prompt or terminal. The output should reflect the updated JRE version.
- Update Java in IDEs and Web Browsers: If you are using Java in integrated development environments (IDEs) or web browsers, make sure to update the JRE settings in those applications as well. This ensures that they are using the latest installed JRE version.
- Test Java Applications: Finally, test your Java applications to ensure that they work as intended with the updated JRE. Verify that the applications run without any compatibility issues or performance problems. If any issues persist, explore other troubleshooting steps or seek assistance from developer communities or support channels.
Updating or reinstalling the JRE can often resolve various issues related to Java applications. Keeping the JRE up to date ensures access to the latest security patches, bug fixes, and performance improvements provided by Oracle. Regularly checking for JRE updates is essential to maintain the stability and security of your Java applications.
Checking for Other Software Interferences
Sometimes, Java-related issues can be caused by conflicts or interference from other software installed on your system. These conflicts can result in compatibility issues or unexpected behavior while running Java applications. To identify and resolve software interferences, consider the following steps:
- Disable Antivirus and Firewall: Antivirus software or firewalls can sometimes interfere with Java applications by blocking network connections or modifying files. Temporarily disable your antivirus software or firewall and test your Java application to see if the issue persists. If the problem is resolved, adjust the settings of your security software to allow Java applications to run properly.
- Check Third-Party Software: Some third-party applications or utilities may also interfere with Java applications. Review the list of recently installed software and disable or uninstall any applications that may be conflicting with Java. Pay particular attention to utilities that modify system settings or interact with Java-related components.
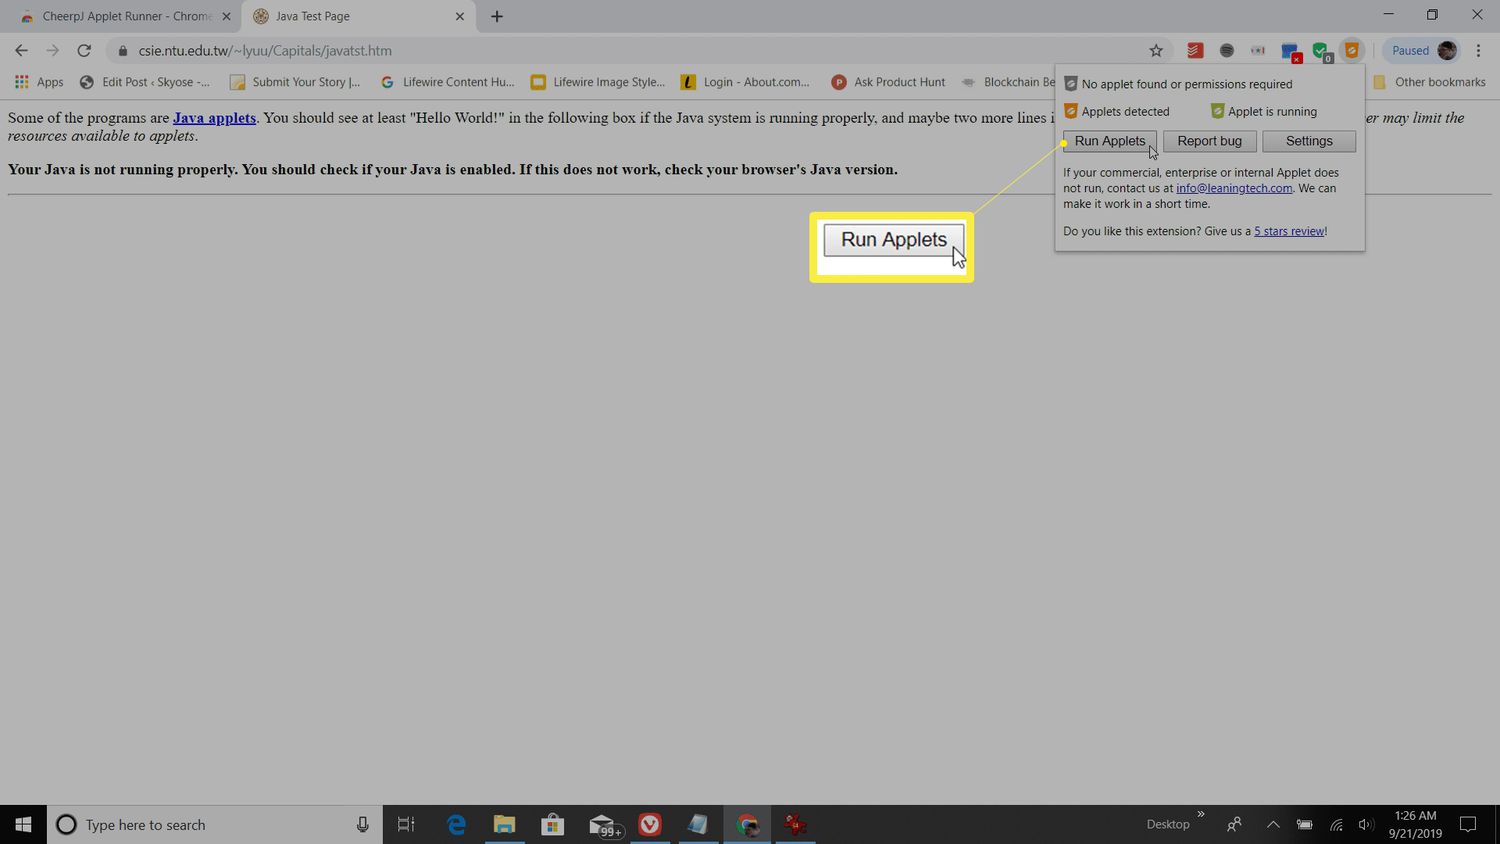
- Check Browser Extensions and Add-ons: If you are experiencing Java-related issues within a web browser, check for any installed browser extensions or add-ons that may be causing interference. Disable or remove any extensions that are known to cause problems with Java applets or web-based Java applications.
- Review System Configuration: Incorrect system configuration can lead to conflicts with Java applications. Review your system settings, such as the environment variables, classpath, or system properties that may affect the behavior of Java applications. Ensure that the settings are properly configured and aligned with the requirements of your Java applications.
- Update Software Dependencies: Java applications often rely on external libraries or frameworks. Outdated or incompatible versions of these dependencies can cause conflicts and inconsistencies. Update the dependencies used by your Java application to the latest stable versions to ensure compatibility and mitigate any known issues.
- Test on a Different System: If possible, test your Java application on a different system to rule out any hardware or software-specific issues. If the application runs smoothly on another system, it suggests that the problem lies within your specific environment, indicating a potential interference from other software.
- Seek Vendor/Developer Support: If the interference persists despite your attempts to resolve it, reach out to the software vendor or seek assistance from the Java application developers. They may be aware of any known conflicts or provide guidance specific to their software.
By checking for other software interferences and eliminating any conflicts or compatibility issues, you can ensure that your Java applications run smoothly and without unexpected interruptions. Remember to document any changes or troubleshooting steps taken to assist with future investigations or support needs.
Optimizing JVM Performance
Optimizing the performance of the Java Virtual Machine (JVM) is crucial to ensure that your Java applications run smoothly and efficiently. By applying performance optimization techniques, you can improve the speed, responsiveness, and scalability of your Java applications. Here are some strategies to optimize JVM performance:
- Tune JVM Settings: Review and adjust the JVM configuration settings to optimize performance. This includes setting appropriate values for the heap size (-Xmx), garbage collector options, thread pools, and other relevant settings. Experiment with different settings and monitor the application’s performance to find the optimal configuration.
- Use Efficient Data Structures and Algorithms: Employ efficient data structures and algorithms in your Java code. Choose the appropriate data structure for the task at hand, considering factors like time complexity and memory usage. Utilize algorithms with better performance characteristics to optimize the execution of specific operations in your application.
- Minimize Object Creation and Garbage Collection: Excessive object creation and frequent garbage collection can degrade performance. Minimize unnecessary object creation and prefer object pooling or reusing objects whenever possible. Avoid excessive or unnecessary object allocation to reduce the overhead of garbage collection.
- Optimize Database Access: Optimize database access to reduce latency and improve performance. Utilize connection pooling techniques, batch processing, and efficient query design to minimize database round-trips and optimize data retrieval and manipulation operations.
- Use Asynchronous Programming: Implement asynchronous programming techniques, such as asynchronous I/O or event-driven architectures, to maximize resource utilization and responsiveness. Asynchronous programming can help avoid blocking operations and improve the scalability of your Java application.
- Profile and Identify Performance Bottlenecks: Use profiling tools to identify performance bottlenecks in your application. Profile critical code sections to identify areas that consume excessive resources or cause performance degradation. Once identified, focus on optimizing these bottleneck areas to gain significant performance improvements.
- Cache Frequently Accessed Data: Cache frequently accessed data to reduce the need for repeated computations or I/O operations. Utilize in-memory caching mechanisms, such as the Java Caching System (JCS) or Memcached, to cache data and improve performance by serving frequently requested data from memory.
- Parallelize and Distribute Workload: Leverage parallel processing and distributed computing techniques to distribute workload across multiple threads or machines. Utilize frameworks like Java’s Concurrency API or Apache Hadoop to parallelize computationally intensive tasks and achieve better performance through parallel execution.
By applying these optimization techniques, you can significantly improve the performance of your Java applications. Remember to regularly monitor and assess the impact of these optimizations to ensure that they align with your application’s requirements. Achieving optimal JVM performance requires iterative adjustments and continuous monitoring as your application evolves and adapts.
Conclusion
Java Virtual Machine (JVM) issues can be troublesome, but with the right knowledge and troubleshooting techniques, you can overcome them effectively. In this article, we explored the different aspects of JVM issues and how to fix them.
We began by understanding the fundamental concept of JVM and its role in running Java applications. We then delved into common JVM issues such as memory problems, crashes, performance bottlenecks, concurrency errors, and version compatibility.
To address JVM crashes, we discussed the importance of collecting crash logs, checking JVM version compatibility, reviewing native libraries, adjusting JVM configuration, analyzing application code, updating dependencies, and seeking vendor support.
When it comes to memory issues, we learned about increasing the heap size, optimizing garbage collection, identifying and fixing memory leaks, releasing unused resources, using efficient data structures, implementing object pooling, and lazy loading techniques.
For debugging JVM errors, we explored steps such as reviewing error messages, enabling debug options, reproducing errors, using debugging tools, analyzing log files, isolating and testing components, and seeking assistance from developer communities and documentation.
We also discussed updating and reinstalling the Java Runtime Environment (JRE) to ensure compatibility and security. Additionally, we emphasized the significance of checking for software interferences, both third-party applications and browser extensions, and provided guidance on optimizing JVM performance through tuning settings, efficient coding practices, profiling, caching, and parallelization.
By applying the strategies and techniques outlined in this article, you can effectively resolve JVM issues, improve the performance of your Java applications, and ensure a smooth and efficient user experience. Remember to stay updated with the latest JVM versions, security patches, and best practices to keep your applications up to date and running optimally.