Introduction
Safari, the sleek and innovative web browser developed by Apple, offers a range of powerful features designed to enhance the browsing experience. One such feature is the Safari Developer Tools, a robust set of utilities that enable users to inspect, debug, and optimize web pages with ease. Whether you're a web developer, designer, or simply a curious user, understanding how to harness the capabilities of Safari Developer Tools can significantly elevate your browsing and troubleshooting proficiency.
In this comprehensive guide, we will delve into the intricacies of inspecting and modifying web page elements using Safari Developer Tools. By the end of this tutorial, you will have a solid grasp of how to navigate through the tools, analyze page structures, and make real-time modifications to web content. Whether you're seeking to uncover the underlying code of a webpage, troubleshoot layout issues, or experiment with design changes, Safari Developer Tools equips you with the necessary arsenal to accomplish these tasks efficiently.
So, let's embark on this enlightening journey through the realm of Safari Developer Tools, where we'll unravel the secrets of inspecting and manipulating web page elements to unlock a world of possibilities. Whether you're a seasoned developer or a curious enthusiast, this guide will equip you with the knowledge and skills to navigate the intricate web of code and design, empowering you to unravel the mysteries of web pages with confidence and finesse.
Opening Safari Developer Tools
To embark on the exhilarating journey of exploring and manipulating web page elements, the first step is to open Safari Developer Tools. Safari offers a seamless and intuitive method to access these powerful tools, allowing users to delve into the intricate layers of web page structures with ease.
To open Safari Developer Tools, simply follow these steps:
-
Launch Safari: Begin by opening the Safari web browser on your Mac or iOS device. Safari Developer Tools are readily accessible within the browser, empowering users to delve into the underlying code and design of web pages effortlessly.
-
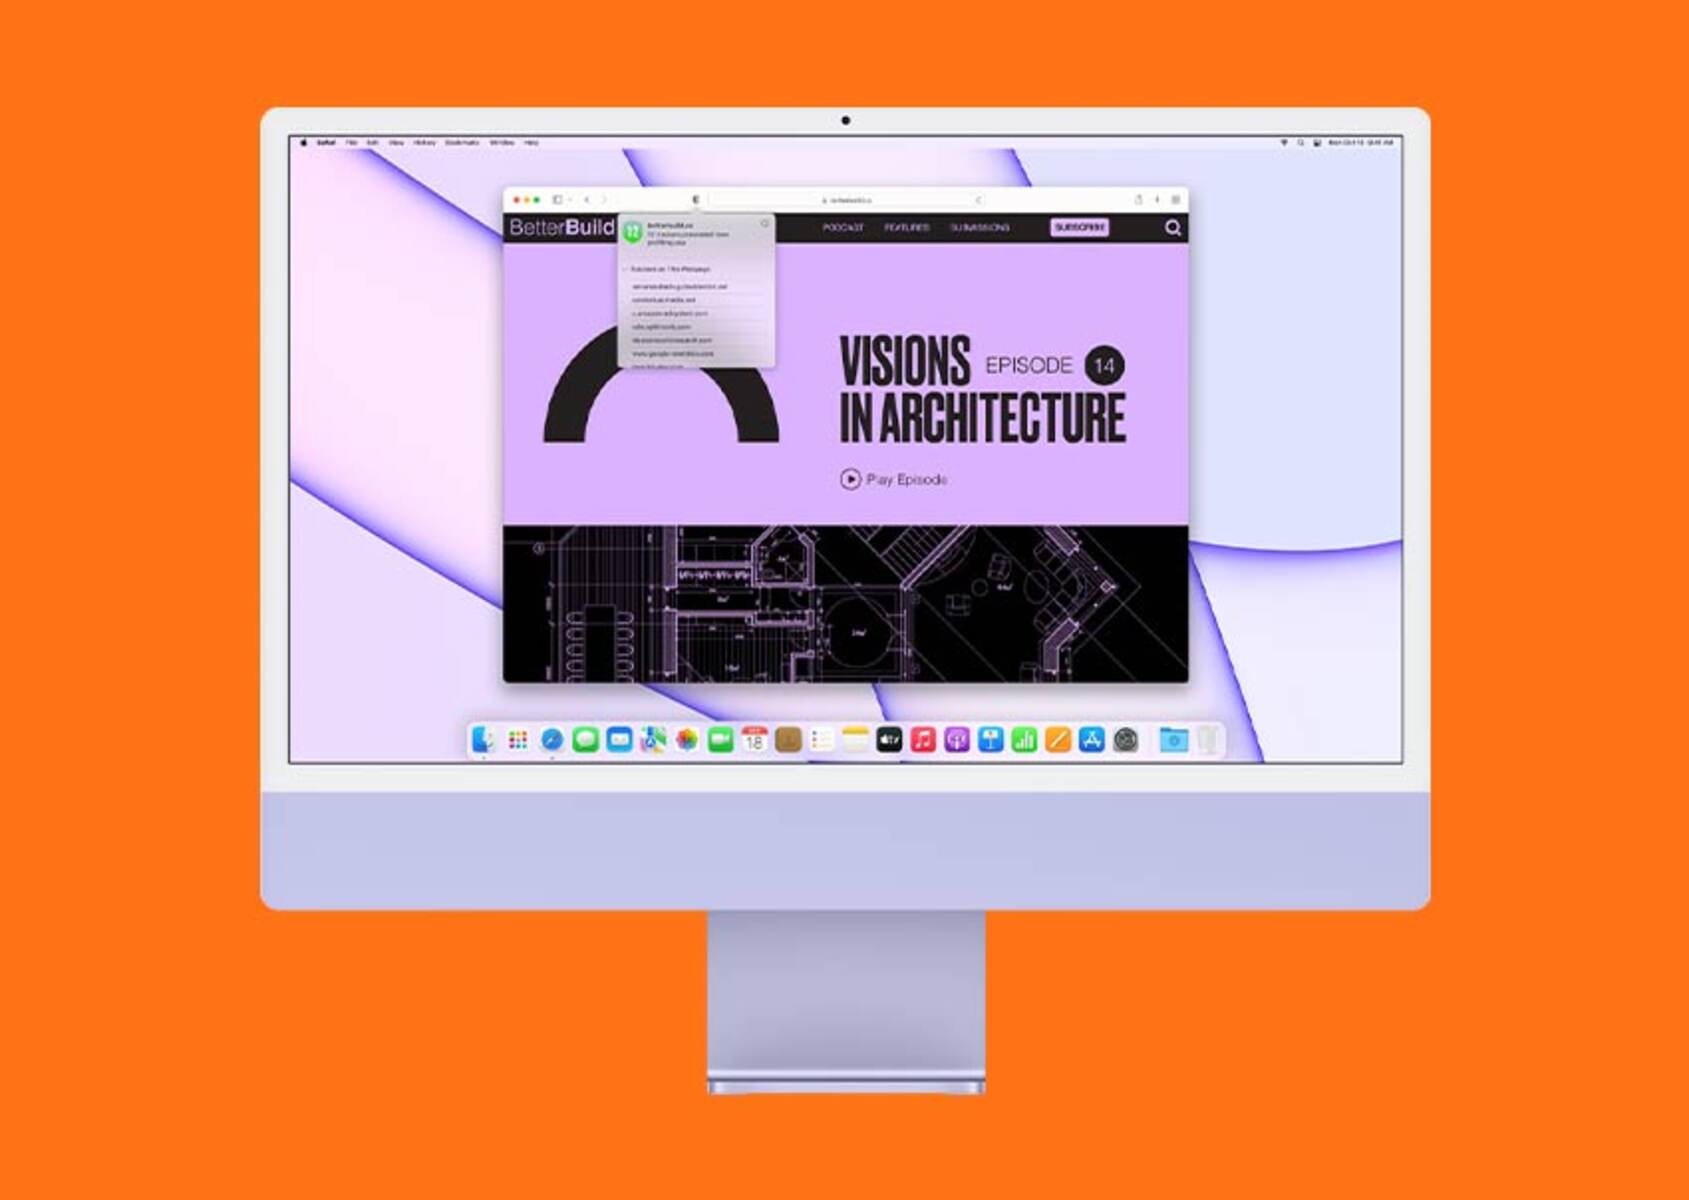
Navigate to the Menu Bar: Once Safari is open, navigate to the menu bar located at the top of the screen. Here, you will find a plethora of options to customize and enhance your browsing experience.
-
Access the Develop Menu: Within the menu bar, locate the "Develop" option. Clicking on this menu will unveil a treasure trove of developer-centric features, including the coveted Safari Developer Tools.
-
Select "Show Web Inspector": Upon clicking the "Develop" menu, a dropdown list will appear, presenting a range of developer-oriented options. Among these options, you will find "Show Web Inspector." Clicking on this option will open the Safari Developer Tools, unveiling a comprehensive suite of utilities designed to empower users to inspect, debug, and optimize web pages with finesse.
-
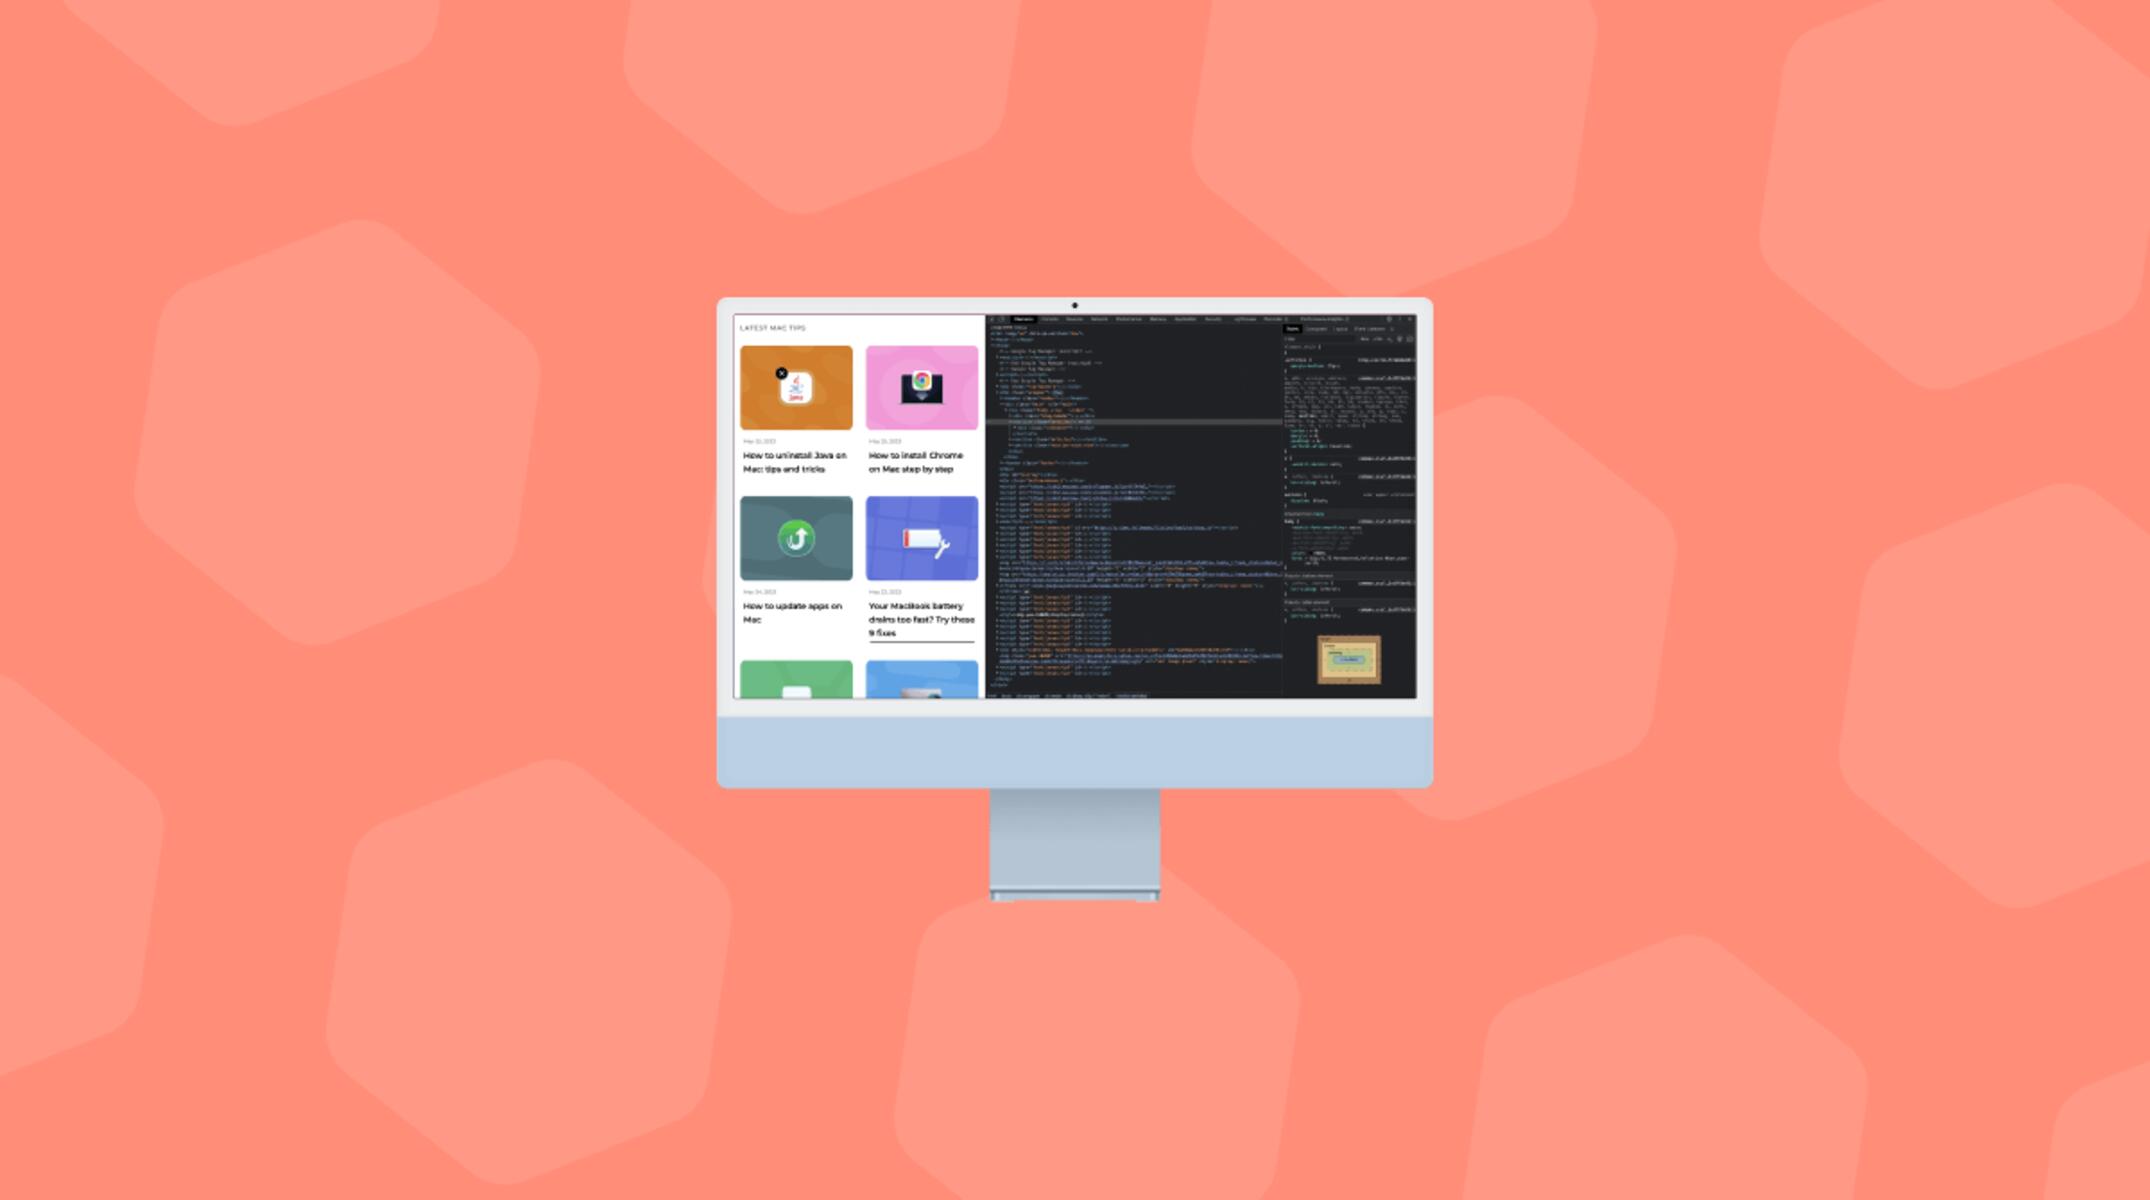
Explore the Tools: With Safari Developer Tools now open, you are poised to embark on an exhilarating journey through the intricate web of code and design. The tools at your disposal include the Elements panel for inspecting and manipulating HTML and CSS, the Console for debugging JavaScript, the Network panel for analyzing network activity, and a myriad of other utilities tailored to elevate your browsing and development prowess.
By following these simple yet powerful steps, you can seamlessly open Safari Developer Tools and unlock a world of possibilities. Whether you're a seasoned developer, a budding designer, or a curious enthusiast, Safari Developer Tools empowers you to unravel the mysteries of web pages with confidence and finesse, opening the door to a realm of endless exploration and innovation.
Inspecting Elements on a Page
Inspecting elements on a web page is a fundamental aspect of web development and design. Safari Developer Tools provides a seamless and intuitive interface for delving into the intricate layers of a web page's structure, allowing users to analyze, modify, and optimize elements with precision. Whether you're seeking to unravel the underlying code, troubleshoot layout issues, or experiment with design changes, the Elements panel within Safari Developer Tools equips you with the necessary arsenal to accomplish these tasks efficiently.
Upon opening Safari Developer Tools and navigating to the Elements panel, you are greeted with a visually intuitive display of the web page's structure. The panel presents a hierarchical view of the HTML elements, allowing you to traverse through the document object model (DOM) with ease. Each element is accompanied by its corresponding CSS properties, providing a comprehensive overview of the page's layout and styling.
As you hover over elements within the Elements panel, Safari empowers you with real-time visual highlighting on the web page, enabling you to pinpoint and inspect specific elements with precision. This dynamic interaction between the panel and the rendered web page fosters a seamless inspection experience, allowing you to identify and analyze elements effortlessly.
Furthermore, Safari Developer Tools offers a range of powerful features within the Elements panel, including the ability to modify element attributes and styles in real time. By simply clicking on an element within the panel, you can access and manipulate its HTML attributes and CSS properties, witnessing the instantaneous impact of your modifications on the rendered web page. This real-time feedback mechanism empowers you to experiment with design changes, troubleshoot layout discrepancies, and optimize the visual presentation of web content with unparalleled efficiency.
In addition to inspecting and modifying individual elements, Safari Developer Tools equips you with the capability to analyze the box model of elements, facilitating a deeper understanding of their dimensions, padding, borders, and margins. This comprehensive insight into the box model empowers you to fine-tune the layout and spacing of elements, ensuring a visually harmonious and well-structured web page.
In essence, the Elements panel within Safari Developer Tools serves as a gateway to the intricate world of web page structures, offering a seamless and powerful interface for inspecting, analyzing, and modifying elements with finesse. Whether you're a seasoned developer, a meticulous designer, or an inquisitive enthusiast, Safari Developer Tools empowers you to unravel the mysteries of web pages with confidence and precision, opening the door to a realm of endless exploration and innovation.
Modifying and Debugging Page Content
Modifying and debugging page content is a pivotal aspect of web development and design, and Safari Developer Tools offers a robust suite of utilities to streamline these processes with finesse. Whether you're seeking to experiment with design changes, troubleshoot layout discrepancies, or optimize the functionality of web elements, Safari Developer Tools equips you with the necessary arsenal to accomplish these tasks efficiently.
Upon opening Safari Developer Tools and navigating to the Elements panel, you gain access to a plethora of powerful features designed to facilitate the modification and debugging of page content. One of the standout capabilities within the Elements panel is the ability to edit HTML and CSS properties in real time. By simply clicking on an element within the panel, you can modify its attributes and styles, witnessing the instantaneous impact of your changes on the rendered web page. This real-time feedback mechanism empowers you to experiment with design alterations, fine-tune layout elements, and optimize the visual presentation of web content with unparalleled efficiency.
Furthermore, Safari Developer Tools offers a comprehensive suite of debugging utilities, including the Console and Sources panels. The Console panel serves as a dynamic environment for debugging JavaScript, enabling you to log messages, inspect variables, and diagnose runtime errors with precision. This invaluable tool empowers you to unravel the intricacies of JavaScript code, identify and rectify bugs, and optimize the functionality of web applications with confidence.
In addition to JavaScript debugging, the Sources panel within Safari Developer Tools provides a seamless interface for inspecting and debugging the source code of web pages. Whether you're analyzing event listeners, setting breakpoints, or tracing the flow of code execution, the Sources panel empowers you to delve into the underlying logic of web applications, facilitating a comprehensive debugging experience.
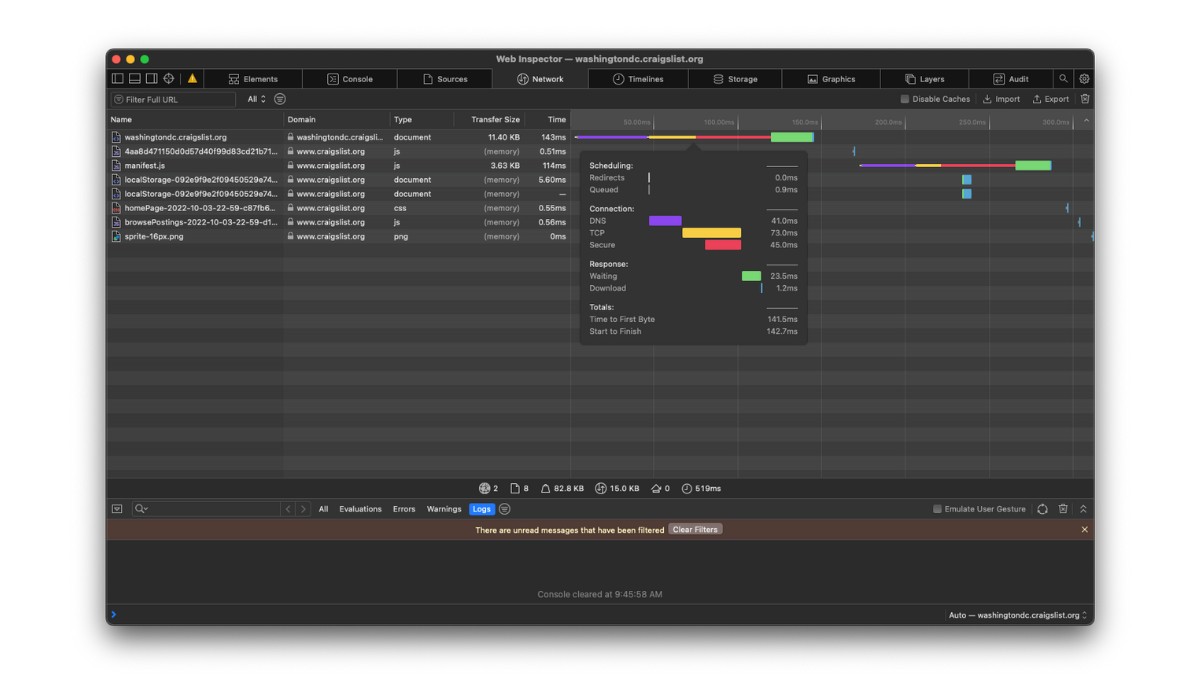
Moreover, Safari Developer Tools offers a range of performance analysis utilities, including the Network panel, enabling you to analyze network activity, monitor resource loading times, and optimize the performance of web pages with precision. This holistic approach to debugging and optimization empowers you to elevate the functionality and user experience of web applications, ensuring a seamless and responsive browsing experience for users.
In essence, Safari Developer Tools serves as a powerhouse for modifying and debugging page content, offering a comprehensive suite of utilities tailored to streamline the development and optimization of web applications. Whether you're a seasoned developer, a meticulous designer, or an inquisitive enthusiast, Safari Developer Tools empowers you to unravel the mysteries of web pages with confidence and finesse, opening the door to a realm of endless exploration and innovation.
Conclusion
In conclusion, Safari Developer Tools stands as a beacon of innovation and empowerment, offering a comprehensive suite of utilities designed to unravel the mysteries of web pages with finesse. Throughout this enlightening journey, we have delved into the intricacies of inspecting and modifying web page elements, harnessing the power of Safari Developer Tools to elevate our browsing and troubleshooting proficiency.
By opening Safari Developer Tools and navigating through the Elements panel, we have witnessed the seamless and intuitive interface that empowers us to analyze, modify, and optimize elements with precision. The real-time feedback mechanism and dynamic interaction between the panel and the rendered web page have fostered a seamless inspection experience, enabling us to pinpoint and inspect specific elements with ease. Furthermore, the ability to modify element attributes and styles in real time has empowered us to experiment with design changes, troubleshoot layout discrepancies, and optimize the visual presentation of web content with unparalleled efficiency.
Moreover, Safari Developer Tools offers a robust suite of utilities for modifying and debugging page content, including the Console and Sources panels, which facilitate JavaScript debugging and source code inspection with finesse. The comprehensive approach to debugging and optimization, coupled with performance analysis utilities such as the Network panel, empowers us to elevate the functionality and user experience of web applications, ensuring a seamless and responsive browsing experience for users.
As we reflect on this enriching exploration of Safari Developer Tools, we emerge equipped with the knowledge and skills to navigate the intricate web of code and design, empowering us to unravel the mysteries of web pages with confidence and finesse. Whether we are seasoned developers, meticulous designers, or inquisitive enthusiasts, Safari Developer Tools opens the door to a realm of endless exploration and innovation, fostering a deep understanding of web page structures and empowering us to optimize the functionality and visual presentation of web content with precision.
In essence, Safari Developer Tools transcends the realm of a mere utility, emerging as a catalyst for creativity, innovation, and empowerment. As we continue to harness the capabilities of Safari Developer Tools in our web development and design endeavors, we embark on a journey of endless possibilities, where the intricate web of code and design unfolds before us, inviting us to explore, innovate, and create with confidence and finesse.