Introduction
In the field of machine learning, evaluating the performance of a model is crucial. It helps us understand how well our model is predicting outcomes and allows us to make informed decisions based on its results. One of the key metrics used to assess the performance of a machine learning model is the model score.
The model score provides a quantitative measure of how well a model is performing in terms of accuracy, precision, recall, or other metrics. It helps us compare different models and determine which one is the most suitable for a given task. But what exactly is model score, and why is it important?
At its core, model score is a numerical value that represents the effectiveness of a machine learning model in making predictions. It is derived from various evaluation metrics that measure the model’s performance against a known set of data. By calculating the model score, we can ascertain the model’s ability to generalize and make accurate predictions on unseen data.
Effectively evaluating a model’s performance is essential in any machine learning project. It allows us to identify models that are underperforming and need improvement or models that are achieving exceptional results. Understanding the strengths and weaknesses of different models helps us make informed decisions about their application and potential limitations.
Throughout this article, we will explore the concept of model score in more detail. We will delve into various model score metrics and discuss how they are calculated and interpreted. Additionally, we will highlight the significance of selecting the appropriate model score metric based on the specific requirements of a machine learning task.
By the end of this article, you will have a clear understanding of model score and its importance in assessing the performance of machine learning models. So, let’s dive in!
What is Model Score?
Model score is a metric that measures the performance of a machine learning model in making predictions on data it hasn’t seen before. It provides a numerical representation of how well the model is able to generalize and make accurate predictions. The higher the model score, the better the model’s performance.
To understand model score, we need to first grasp the concept of evaluation metrics. Evaluation metrics are used to assess the performance of a model by comparing its predictions with the actual outcomes. These metrics quantify the model’s accuracy, precision, recall, and other factors depen*ding on the specific task at hand.
The model score is derived from these evaluation metrics. It is a single value that summarizes the model’s overall performance. The calculation of the model score depends on the chosen evaluation metric, such as accuracy, precision, recall, F1 score, AUC-ROC score, or others. Each metric provides a different perspective on the model’s performance and has its own significance in different scenarios.
Model score plays a vital role in selecting the most appropriate model for a given task. By comparing the scores of different models, we can determine which one is the most effective in generating accurate predictions. Additionally, model score helps us identify areas where a model may be underperforming or where improvements can be made to enhance its predictive capabilities.
It’s important to note that the choice of model score metric depends on the nature of the problem being solved. For example, in a binary classification problem where correctly identifying positive cases is crucial, precision and recall may be more relevant metrics than overall accuracy.
Overall, model score is a fundamental tool in machine learning that allows us to assess and compare the performance of different models. It enables us to make data-driven decisions based on the model’s ability to predict outcomes accurately. By leveraging model score, we can ensure that our machine learning models are effective and reliable in various real-world applications.
Why is Model Score Important?
The model score is a crucial component in evaluating the performance of machine learning models. It provides valuable insights into how well a model is performing and its ability to generalize to unseen data. Here are the key reasons why model score is important:
1. Performance Assessment: The model score allows us to assess how well a model is making predictions. It provides a quantitative measure of the model’s accuracy, precision, recall, or other relevant evaluation metrics. By analyzing the model score, we can identify models that are performing exceptionally well or underperforming, enabling us to make informed decisions on model selection and improvement.
2. Model Comparison: Model score helps us compare different machine learning models and determine which one is the most suitable for a given task. By calculating and comparing the scores of multiple models, we can select the model that achieves the best performance. This is especially crucial when there are various algorithms or approaches available for a specific problem.
3. Generalization: Machine learning models are trained on a specific dataset, but they are ultimately deployed to make predictions on new, unseen data. The model score provides a measure of how well the model generalizes to this new data. A high model score indicates that the model is effective in making accurate predictions on unseen instances, while a low score may suggest that the model is overfitting or not capturing the underlying patterns effectively.
4. Decision-Making: Model score plays a crucial role in decision-making processes. In many real-world applications, the predictions made by machine learning models directly impact important decisions. For example, in healthcare, model scores can help doctors determine the likelihood of a patient having a certain disease, influencing treatment plans and medical interventions.
5. Improvement and Optimization: Model score provides valuable feedback for model improvement and optimization. By identifying areas where a model is underperforming or making errors, we can fine-tune the model to enhance its predictive capabilities. Model score acts as a guidepost, indicating whether changes to the model’s architecture, data preprocessing techniques, or feature engineering are necessary to achieve better results.
6. Confidence and Reliability: High model scores instill confidence in stakeholders who rely on the predictions made by machine learning models. When a model consistently achieves a high score, it indicates that the model is reliable and trustworthy. This is particularly important in industries such as finance, where accurate predictions can impact financial decisions and outcomes.
7. Continuous Evaluation: Model score allows for continuous evaluation of the model’s performance over time. As new data becomes available, the model can be re-evaluated, and the score can be updated. This ongoing assessment helps ensure that the model remains effective and relevant in dynamic environments.
Overall, model score is essential in machine learning as it enables us to assess, compare, and improve the performance of different models. It serves as a guide in decision-making, supports optimization efforts, and instills confidence in the reliability of machine learning predictions.
How is Model Score Calculated?
The calculation of the model score depends on the chosen evaluation metric, which varies depending on the specific problem and the nature of the data. Here are some common methods for calculating model score:
1. Accuracy: Accuracy is one of the simplest and most commonly used evaluation metrics. It measures the proportion of correctly predicted instances out of the total number of instances. The formula for accuracy is:
Accuracy = (Number of Correct Predictions) / (Total Number of Predictions)
2. Precision: Precision measures the proportion of true positive predictions out of all positive predictions. It is particularly important in tasks where there is a significant cost associated with false positives. The formula for precision is:
Precision = (Number of True Positives) / (Number of True Positives + Number of False Positives)
3. Recall: Recall, also known as sensitivity or true positive rate, measures the proportion of true positive predictions out of all actual positive instances. Recall is crucial in tasks where correctly identifying positives is essential. The formula for recall is:
Recall = (Number of True Positives) / (Number of True Positives + Number of False Negatives)
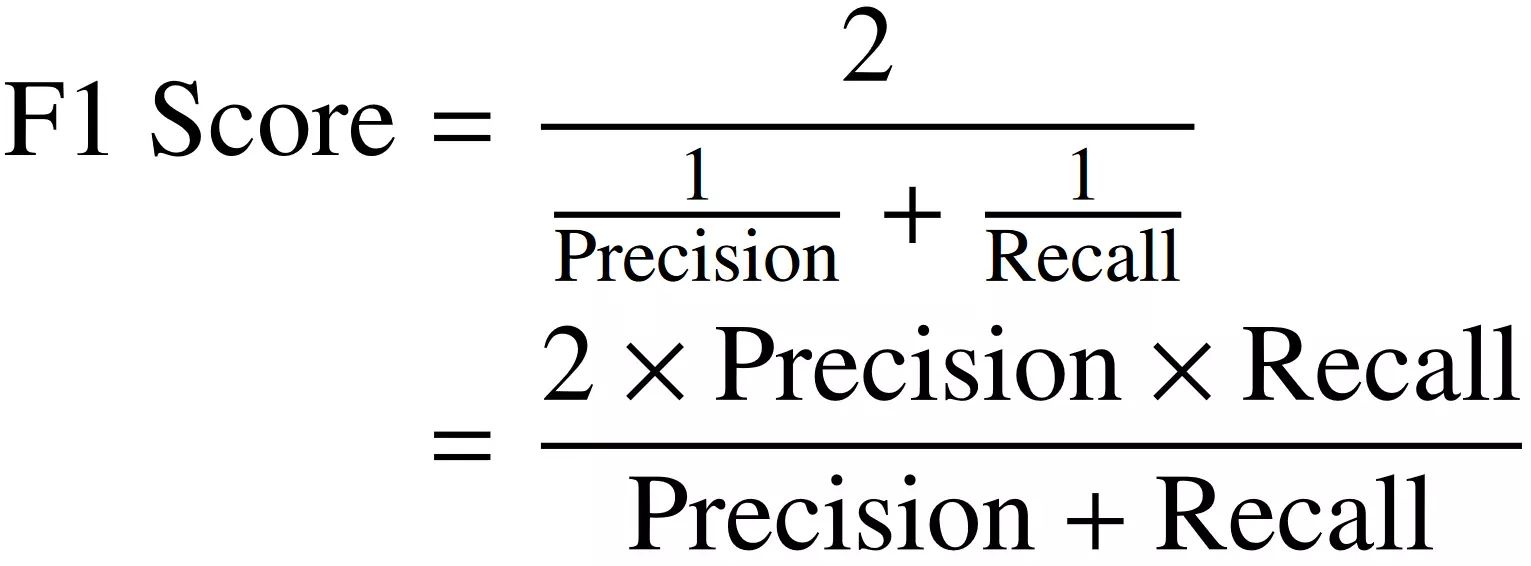
4. F1 Score: The F1 score combines precision and recall into a single metric that balances both factors. It provides a measure of the model’s overall performance by considering the trade-off between precision and recall. The formula for F1 score is:
F1 Score = 2 * ((Precision * Recall) / (Precision + Recall))
5. AUC-ROC Score: The area under the receiver operating characteristic curve (AUC-ROC) is often used for binary classification problems. It represents the probability that the model will rank a randomly chosen positive instance higher than a randomly chosen negative instance. The value ranges from 0.5 (no discrimination) to 1 (perfect discrimination).
These are just a few examples of how model score can be calculated using different evaluation metrics. The choice of metric depends on the problem at hand and the specific requirements of the task. It’s essential to select the most appropriate evaluation metric that aligns with the goals and priorities of the project.
In addition to these standard evaluation metrics, there may be other specialized metrics available for specific tasks or domains. It’s important to explore and understand the available metrics to make informed decisions about evaluating and comparing model performance.
By calculating the model score using appropriate evaluation metrics, we can quantitatively measure and compare the performance of different machine learning models. This allows us to make data-driven decisions and choose the most suitable model for a given task.
Different Model Score Metrics
When assessing the performance of a machine learning model, various evaluation metrics can be used to calculate the model score. These metrics provide different insights into the model’s predictions and have different applications depending on the specific task. Here are some commonly used model score metrics:
1. Accuracy: Accuracy measures the proportion of correctly predicted instances out of the total number of instances. It is a widely used metric when the distribution of classes is balanced. However, accuracy can be misleading in imbalanced datasets, where a high accuracy score might not indicate the model’s effectiveness in accurately predicting minority classes.
2. Precision: Precision calculates the proportion of true positive predictions out of all positive predictions. It is useful in scenarios where false positives need to be minimized, such as spam email detection. A high precision score indicates a low rate of false positives.
3. Recall: Recall, also known as sensitivity or true positive rate, measures the proportion of true positive predictions out of all actual positive instances. It is relevant in situations where false negatives should be minimized, such as detecting diseases. A high recall score indicates a low rate of false negatives.
4. F1 Score: The F1 score is a harmonic mean of precision and recall. It provides a balanced assessment of a model’s performance that accounts for both false positives and false negatives. The F1 score tends to prioritize models that have a good balance between precision and recall.
5. AUC-ROC Score: The AUC-ROC score is often used in binary classification problems. It represents the area under the receiver operating characteristic curve. This metric measures how well the model can distinguish between positive and negative instances across various classification thresholds. The AUC-ROC score ranges from 0.5 (random predictions) to 1 (perfect predictions).
6. Mean Absolute Error (MAE): MAE evaluates the average absolute difference between the predicted values and the actual values. It is used in regression tasks and provides an intuitive understanding of how far off the predictions are from the true values. A lower MAE indicates a better model fit.
7. Mean Squared Error (MSE): MSE calculates the average squared difference between the predicted values and the actual values. Like MAE, MSE is commonly employed in regression tasks. It emphasizes larger prediction errors and is more sensitive to outliers. MSE is often used for optimization purposes.
These are just a few examples of the model score metrics used in machine learning. The choice of metric depends on the specific requirements and objectives of the task. It is essential to select the appropriate metric that aligns with the goals of the project and provides meaningful insights into the model’s performance.
While each model score metric assesses the model’s performance from a different angle, it is important to consider multiple metrics to have a comprehensive understanding. Depending on the complexity of the problem, it may be necessary to prioritize certain metrics over others or even create custom metrics that better capture the task-specific requirements.
By considering and analyzing different model score metrics, we can gain a deeper understanding of a machine learning model’s performance and make informed decisions about its effectiveness for a given task.
Accuracy
Accuracy is one of the most commonly used evaluation metrics to assess the performance of a machine learning model. It measures the proportion of correctly predicted instances out of the total number of instances. Accuracy provides a general overview of how well the model is making correct predictions.
The formula for accuracy is:
Accuracy = (Number of Correct Predictions) / (Total Number of Predictions)
Accuracy is particularly useful when the classes in the dataset are balanced, meaning they have a similar number of instances. In such cases, accuracy can be a reliable indicator of model performance.
For example, if we have a binary classification problem where we are predicting whether an email is spam or not, accuracy will tell us how well the model is classifying both spam and non-spam emails.
However, accuracy can be misleading when dealing with imbalanced datasets. In situations where one class is significantly more dominant than the others, the accuracy metric may be high even if the model performs poorly on the minority class.
Consider a medical diagnosis scenario where we want to detect a rare disease that occurs in only 1% of the population. If our model predicts all instances as negative (non-disease), it would still achieve an accuracy of 99%. However, this model would be of no practical use as it fails to identify any positive cases.
In such imbalanced scenarios, it is important to consider other evaluation metrics like precision, recall, or F1 score to get a more comprehensive picture of the model’s performance.
Accuracy alone does not provide insights into the specifics of the model’s mistakes. It treats all misclassifications equally regardless of the type of error. Therefore, it is crucial to look at other evaluation metrics to understand the true performance of the model.
Despite its limitations, accuracy remains a valuable metric, especially when classes are well-balanced. It provides a simple and intuitive measure of a model’s performance and can be a good starting point for evaluating models in various machine learning tasks.
Precision
Precision is an important evaluation metric that measures the proportion of true positive predictions out of all positive predictions made by a machine learning model. It focuses on the accuracy of positive predictions, making it particularly useful in scenarios where false positives need to be minimized.
The formula for precision is:
Precision = (Number of True Positives) / (Number of True Positives + Number of False Positives)
Precision provides insights into how well a model identifies positive instances correctly. It tells us the percentage of predicted positives that are actually true positives, thus indicating the model’s ability to avoid false positives.
Consider a binary classification problem where we are predicting whether a credit card transaction is fraudulent or not. High precision means that the model accurately identifies genuine transactions as non-fraudulent and minimizes the incorrect labeling of genuine transactions as fraud.
However, a model with high precision may still miss some positive instances, leading to false negatives. Precision alone does not take into account false negatives, which are instances that are actually positive but are wrongly classified as negative.
It’s important to note that precision and recall are inversely related. As we increase the threshold for classifying an instance as positive, precision generally increases, but recall decreases. The choice of threshold depends on the specific task and the trade-off between minimizing false positives and false negatives.
In some cases, precision may be the more critical metric to optimize. For example, in medical diagnosis, where false positives can lead to unnecessary treatments or interventions, a high precision is typically desired to minimize incorrect positive predictions.
However, precision should not be considered in isolation. It is essential to consider other metrics, such as recall and F1 score, to get a comprehensive understanding of the model’s overall performance. A high precision can be misleading if the model has low recall, meaning it misses many true positive instances.
By calculating and analyzing precision, we can gain insights into a model’s accuracy in predicting positive instances. It helps us evaluate the model’s ability to minimize false positives and make more reliable predictions in specific machine learning tasks.
Recall
Recall, also known as sensitivity or true positive rate, is an important evaluation metric in machine learning that measures the proportion of true positive predictions out of all actual positive instances. Recall focuses on the ability of a model to identify positive instances correctly and is particularly useful in scenarios where false negatives need to be minimized.
The formula for recall is:
Recall = (Number of True Positives) / (Number of True Positives + Number of False Negatives)
Recall provides insights into how well a model captures all positive instances. It measures the percentage of actual positives that are correctly identified as positives by the model, thus indicating the model’s ability to avoid false negatives.
Consider a medical diagnosis scenario where we want to detect a specific disease. High recall means that the model can correctly identify most of the actual positive cases, minimizing the instances of the disease going undetected.
However, a model with high recall may also have a higher number of false positives, incorrectly labeling negative instances as positive. This trade-off between recall and precision needs to be considered and optimized based on the specific requirements of the task.
While recall focuses on minimizing false negatives, it does not consider false positives, which are instances that are actually negative but incorrectly classified as positive. Therefore, it is crucial to assess other evaluation metrics such as precision, F1 score, or the specific requirements of the task to obtain a more complete understanding of the model’s performance.
In certain applications, such as disease detection or anomaly detection, high recall is typically prioritized to minimize the chances of missing critical positive instances. On the other hand, in scenarios where false positives carry significant consequences, precision may be favored over recall to keep false positives to a minimum.
By calculating and analyzing recall, we can gain insights into a model’s ability to identify positive instances correctly. It helps us evaluate the model’s performance in minimizing false negatives and capturing as many actual positives as possible in various machine learning tasks.
F1 Score
The F1 score is a commonly used evaluation metric in machine learning that combines precision and recall into a single metric. It provides a balanced assessment of a model’s performance by taking into account both the ability to minimize false positives (precision) and the ability to minimize false negatives (recall).
The formula for the F1 score is:
F1 Score = 2 * ((Precision * Recall) / (Precision + Recall))
The F1 score is the harmonic mean of precision and recall, giving equal weight to both metrics. It ranges from 0 to 1, with 1 indicating a perfect model that achieves both high precision and high recall.
The F1 score is especially useful when we want to find a balance between precision and recall. It is commonly used in tasks where false positives and false negatives need to be minimized, such as sentiment analysis or fraud detection.
A high F1 score indicates that the model has a good balance between precision and recall, meaning it can make accurate predictions while capturing a significant proportion of positive instances. On the other hand, a low F1 score suggests that the model may be biased towards either precision or recall, resulting in a trade-off between false positives and false negatives.
The F1 score is particularly valuable when classes are imbalanced. It evaluates the overall performance of the model by considering both the minority and majority classes. In situations where accuracy may be misleading due to the dominance of one class, the F1 score provides more reliable insights into the model’s effectiveness.
It is important to note that the choice of metric depends on the specific requirements of the task. In some scenarios, precision or recall may be more crucial, and the F1 score helps strike a balance between these metrics.
By calculating and analyzing the F1 score, we can gain a comprehensive understanding of a machine learning model’s performance. It helps to find the optimal balance between minimizing false positives and false negatives, leading to more reliable predictions in various machine learning tasks.
AUC-ROC Score
The AUC-ROC (Area Under the Receiver Operating Characteristic Curve) score is a widely used evaluation metric in machine learning, particularly for binary classification problems. It measures the performance of a model in distinguishing between positive and negative instances across various classification thresholds.
The ROC curve is created by plotting the true positive rate (sensitivity/recall) against the false positive rate (1 – specificity) at different threshold settings. The AUC-ROC score represents the area under this curve, which ranges from 0.5 (no discrimination) to 1 (perfect discrimination).
The AUC-ROC score provides a measure of the model’s ability to accurately separate positive and negative instances, regardless of the threshold used for classification. It evaluates the overall performance of the model across all possible threshold settings, making it robust to imbalanced datasets and varying decision thresholds.
A high AUC-ROC score indicates that the model has a strong discriminatory ability and can effectively rank positive instances higher than negative instances. It suggests that the model can make reliable predictions and demonstrates good classification performance.
The AUC-ROC score is particularly useful when the dataset is imbalanced or when the costs of false positives and false negatives are different. It provides a holistic assessment of the model’s performance, allowing for better decision-making regarding the threshold choice.
For example, in a medical diagnosis problem, where correctly identifying true positive cases is crucial, the AUC-ROC score helps evaluate the model’s ability to rank positive cases higher than negative cases across various threshold settings, leading to better diagnostic decisions.
It’s important to note that the AUC-ROC score does not provide insights into the specific predictions at a fixed threshold. To make decisions based on the specific requirements of a task, additional evaluation metrics such as precision, recall, or F1 score may be considered in conjunction with the AUC-ROC score.
By calculating the AUC-ROC score and analyzing the ROC curve, we can gain a comprehensive understanding of a machine learning model’s ability to discriminate between positive and negative instances. It helps in evaluating overall classification performance, adjusting decision thresholds, and making informed decisions in various binary classification tasks.
Choosing the Right Model Score Metric
When evaluating the performance of a machine learning model, choosing the right model score metric is crucial. The selection of the metric depends on the specific requirements of the task and the priorities of the project. Here are some factors to consider when choosing the appropriate model score metric:
1. Task Objective: Consider the ultimate goal of the task. Determine whether correctly identifying positive instances (e.g., disease diagnosis) or minimizing false positives (e.g., spam detection) is more critical. This will guide you towards metrics like recall or precision, which align with the specific task objective.
2. Class Distribution: Take into account the distribution of classes in the dataset. If the classes are well-balanced, accuracy can provide a reliable overall performance measure. However, in imbalanced datasets, where one class is dominant, metrics like precision, recall, or F1 score are better suited to assess the model’s performance.
3. Cost of Errors: Consider the consequences associated with different types of errors. Identify if false positives or false negatives have varying impacts. For instance, in the medical domain, incorrectly classifying a disease as non-existent (false negative) may have severe consequences. In such cases, metrics like recall may take precedence over precision.
4. Trade-Offs: Understand the trade-offs between different evaluation metrics. Metrics like precision and recall are inversely related, meaning that improving one might lead to a decrease in the other. The F1 score provides a balanced measure that considers both metrics equally, making it suitable when striking a balance is crucial.
5. Dataset Characteristics: Evaluate the nature of the dataset, including the presence of outliers, data distribution, and specific data patterns. Certain evaluation metrics may be more sensitive to outliers or better suited for skewed datasets.
6. Domain Expertise: Seek input from domain experts who have knowledge and understanding of the task and its requirements. They can provide valuable insights on which evaluation metrics are most relevant and meaningful for the specific domain.
7. Overall Model Performance: Consider a combination of evaluation metrics to have a comprehensive understanding of the model’s performance. While a single metric provides a specific perspective, multiple metrics give a more complete picture. Accurately assessing the model’s strengths and weaknesses may require a combination of evaluation metrics.
Ultimately, the choice of the model score metric should align with the goals and requirements of the task at hand. Understanding the trade-offs and nuances of different metrics allows for informed decision-making and the selection of the most appropriate model score metric for accurate performance evaluation.
Conclusion
Evaluating and understanding the performance of machine learning models is essential for making informed decisions and optimizing results. Model score metrics play a critical role in this process by quantifying the performance of models and providing valuable insights. In this article, we explored various model score metrics, including accuracy, precision, recall, F1 score, and AUC-ROC score.
We learned that accuracy provides an overall measure of a model’s correctness, but it may not be suitable for imbalanced datasets. Precision focuses on minimizing false positives, while recall aims to reduce false negatives. The F1 score strikes a balance between precision and recall, making it suitable when both metrics are important to consider. The AUC-ROC score evaluates the model’s ability to discriminate between positive and negative instances across different threshold settings.
Choosing the right model score metric depends on factors such as the task objective, class distribution, cost of errors, trade-offs, dataset characteristics, and domain expertise. By carefully considering these factors, we can select the most appropriate metric to evaluate model performance accurately.
It is important to note that no single model score metric can provide a complete picture of a model’s performance. Often, a combination of metrics is necessary to gain a comprehensive understanding. By analyzing multiple metrics, we can effectively assess the strengths and weaknesses of models, make informed decisions, and continuously improve their performance.
Ultimately, the selection of the model score metric should align with the goals, priorities, and specific requirements of the task at hand. By carefully considering the nuances of different metrics and evaluating their suitability, we can confidently evaluate and compare the performance of machine learning models, leading to more accurate predictions and successful outcomes.