Introduction
Welcome to the fascinating world of EKG monitoring. Whether you’re a healthcare professional or just curious about how the heart functions, understanding how to read an EKG monitor can provide valuable insights into cardiac health. An electrocardiogram (EKG) is a graphical representation of the electrical activity in the heart, captured by placing electrodes on the body’s surface. By analyzing the different components of an EKG strip, healthcare professionals can identify potential abnormalities and make informed treatment decisions.
In this article, we will take a closer look at the various elements of an EKG strip and learn how to interpret them. We will explore the significance of heart rate, the importance of P-waves and QRS complexes, and the pattern of T-waves. Additionally, we will delve into the PR interval, ST segment, and QT interval – all of which provide valuable information about the heart’s electrical activity.
By the end of this article, you will have a solid understanding of how to read an EKG monitor and gain insights into the overall cardiac function. So, let’s dive in and unravel the mysteries of this diagnostic tool.
Understanding the EKG Monitor
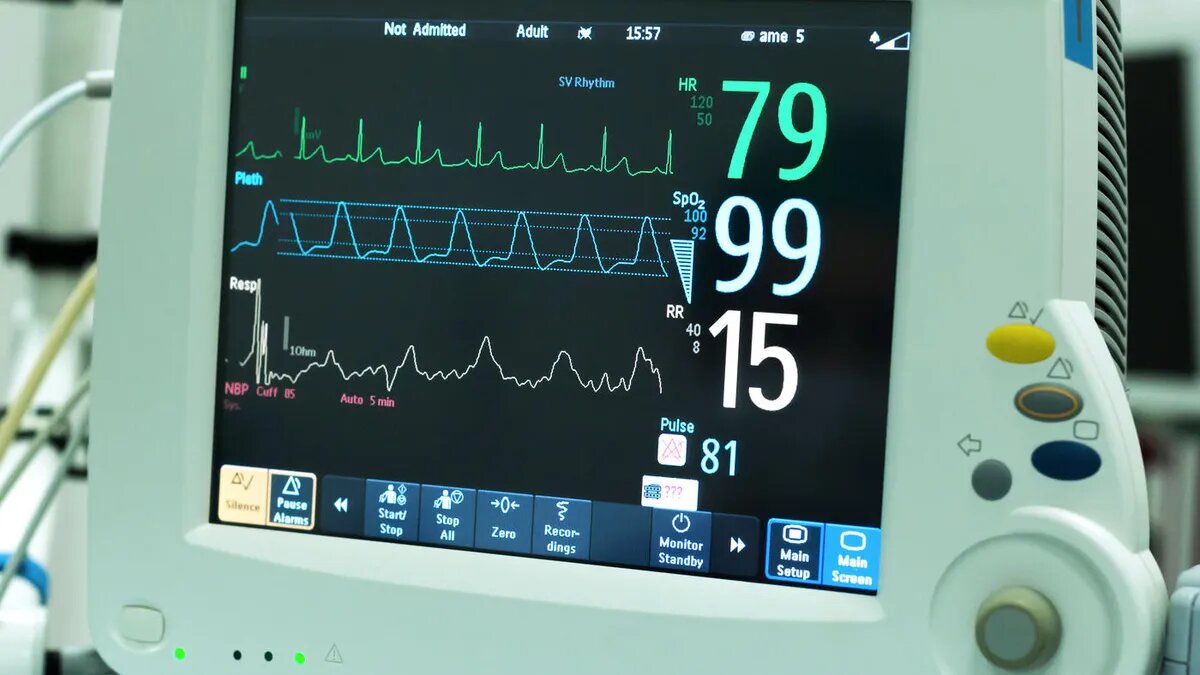
The EKG monitor is a vital tool used in healthcare settings to measure and display the electrical activity of the heart. It helps healthcare professionals diagnose various cardiac conditions, such as arrhythmias, myocardial infarctions, and heart failure. To effectively interpret the information displayed on an EKG monitor, it is crucial to understand its basic features and functionality.
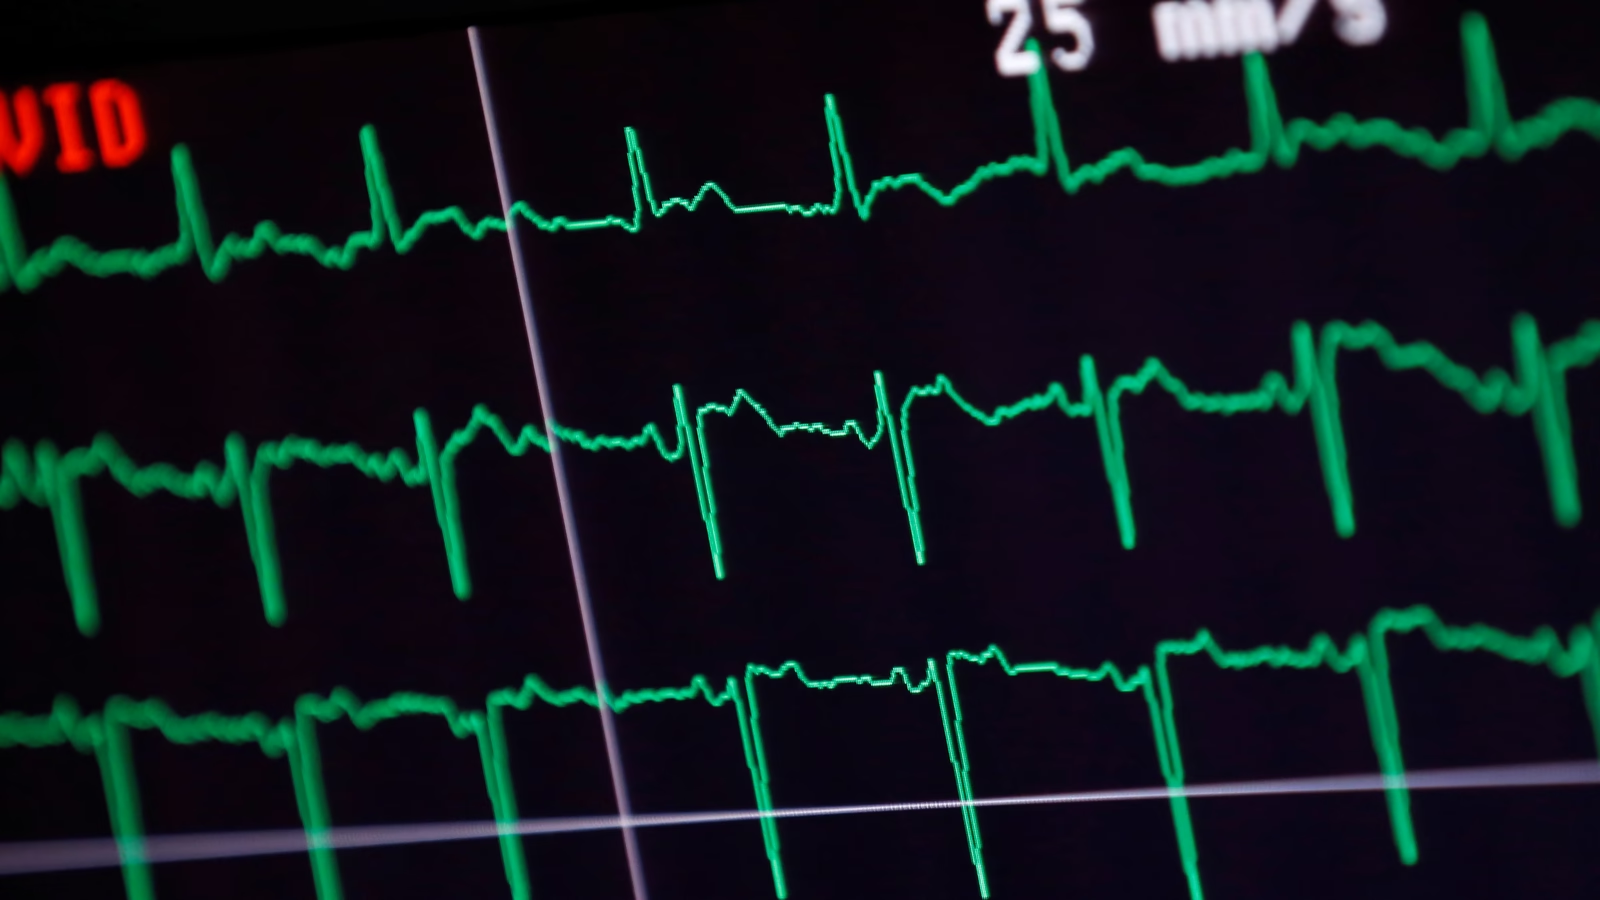
When observing an EKG monitor, you will typically see a graph with vertical and horizontal lines. The vertical lines represent voltage, while the horizontal lines indicate time. The graph consists of a series of waves and complexes, each representing a specific electrical event in the heart.
One of the most fundamental aspects of the EKG monitor is heart rate. The heart rate is typically expressed in beats per minute (bpm) and is calculated by determining the time interval between consecutive R-waves. A normal resting heart rate ranges from 60 to 100 bpm, but this may vary depending on individual factors such as age, fitness level, and underlying health conditions.
Another critical feature of the EKG monitor is the P-wave. The P-wave represents the electrical impulse that originates in the sinoatrial (SA) node and spreads through the atria, causing them to contract. The presence and shape of the P-wave can provide insights into atrial activity and help identify conditions such as atrial fibrillation or atrial flutter.
Furthermore, the QRS complex represents the electrical conduction through the ventricles, leading to ventricular contraction. It typically consists of three waves: Q, R, and S. The QRS complex duration can help diagnose conditions like bundle branch blocks or ventricular hypertrophy.
Understanding the basic components of an EKG strip is essential in interpreting the information accurately. By identifying and analyzing features such as heart rate, P-waves, and QRS complexes, healthcare professionals can gain valuable insights into a patient’s cardiac health and provide appropriate treatment or further investigation when necessary.
Anatomy of an EKG Strip
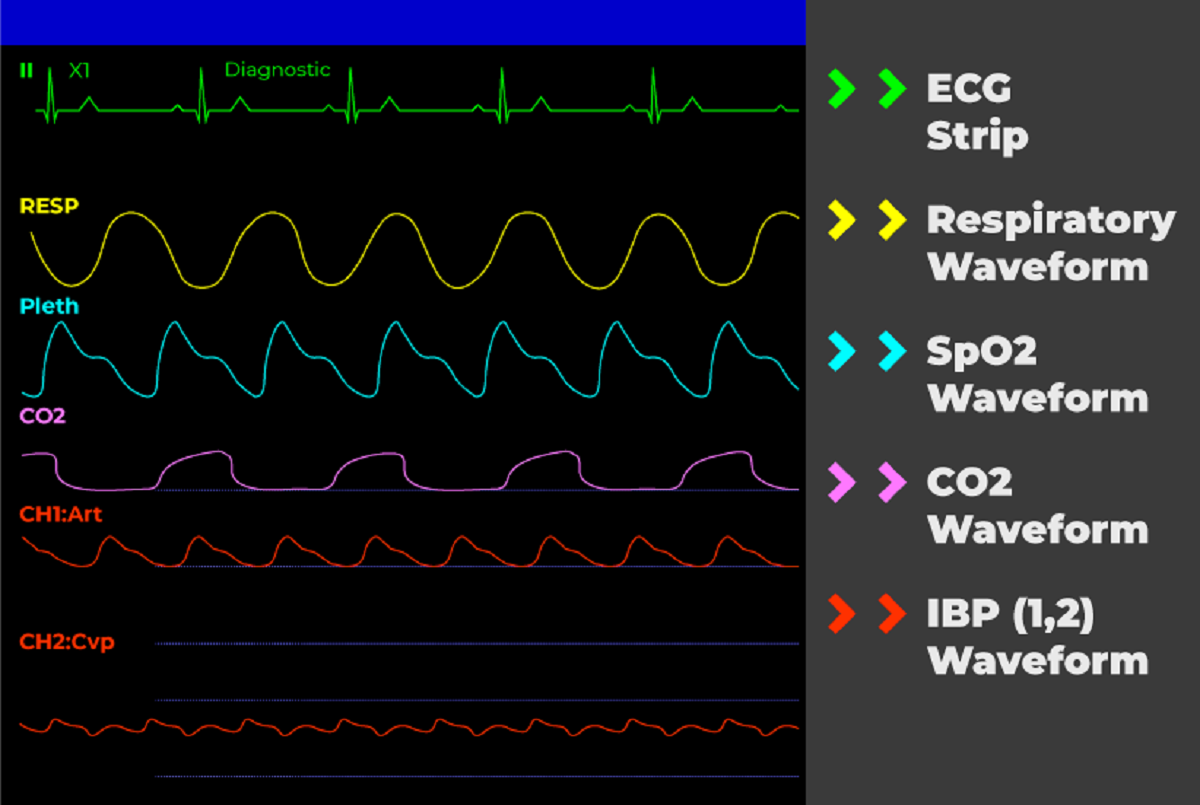
An EKG strip, also known as an electrocardiogram strip or rhythm strip, is a graphical representation of the electrical activity of the heart over a specific period. It provides valuable information about the heart’s rhythm, rate, and different electrical events. Understanding the various components of an EKG strip is crucial for accurate interpretation.
The EKG strip consists of several key elements that deserve attention:
- Baseline: The baseline is the flat line seen between the waves and complexes on the EKG strip. It represents the absence of electrical activity in the heart.
- Waves: Waves in an EKG strip represent specific electrical events. The P-wave represents atrial depolarization, the QRS complex represents ventricular depolarization, and the T-wave represents ventricular repolarization.
- Segments: Segments are the flat lines connecting the waves. The PR segment represents the time between atrial depolarization and ventricular depolarization, and the ST segment represents the time between ventricular depolarization and ventricular repolarization.
- Intervals: Intervals are the measurements from one wave to another. The PR interval represents the time between atrial depolarization and ventricular depolarization, and the QT interval represents the time between ventricular depolarization and ventricular repolarization.
Reading an EKG strip involves analyzing the height, duration, and shape of these components. It is essential to observe subtle variations in these measurements, as they can provide vital clues about the heart’s electrical activity and potential abnormalities.
In addition to the waves, segments, and intervals, artifacts can appear on an EKG strip, which are extraneous signals that can distort the accuracy of the reading. Common artifacts include muscle tremors, patient movement, or poor electrode placement. It is crucial to recognize and address these artifacts to ensure the reliability of the EKG strip.
By familiarizing yourself with the anatomy of an EKG strip and understanding the significance of each component, you will be better equipped to interpret the information it provides. Remember, accurate interpretation requires a combination of knowledge, experience, and attention to detail.
Interpreting Heart Rate (HR)
Interpreting heart rate (HR) is a fundamental aspect of reading an EKG strip. Heart rate refers to the number of times the heart beats per minute and can provide valuable insights into cardiac health. Understanding how to accurately calculate and interpret heart rate is essential for evaluating the overall rhythm and function of the heart.
To calculate heart rate, we typically look at the R-R interval – the time between consecutive R-waves on the EKG strip. One way to determine heart rate is by using the 300 rule: divide 300 by the number of large squares between R-waves. For example, if there are two large squares between R-waves, the heart rate would be 150 bpm (300 divided by 2).
However, it’s important to note that the 300 rule is an approximation and not always precise. For more accurate calculations, it is recommended to use specialized EKG software or digital tools that provide precise measurements of the R-R intervals.
An abnormal heart rate can indicate various conditions. Bradycardia refers to a heart rate below 60 bpm and may be a sign of sinus node dysfunction, medication side effects, or hypothyroidism, among other causes. Tachycardia, on the other hand, is a heart rate exceeding 100 bpm and can be associated with conditions like anxiety, fever, heart failure, or arrhythmias.
It’s important to note that heart rate varies among individuals and can also be influenced by factors such as age, medications, physical activity, and overall health. Therefore, it is crucial to consider the context and individual circumstances when interpreting heart rate readings.
By analyzing the heart rate on an EKG strip, healthcare professionals can gain insights into the rhythm, regularity, and overall function of the heart. It is an essential component of EKG interpretation and serves as a baseline for further analysis of other EKG features such as P-waves, QRS complexes, and T-waves.
Remember, heart rate interpretation is just one piece of the puzzle, and it should be evaluated in conjunction with other EKG measurements and the patient’s clinical history to determine the underlying cause of any abnormalities.
Analyzing the P-Wave
The P-wave is an essential component of an EKG strip and represents the electrical impulse that originates in the sinoatrial (SA) node. Analyzing the P-wave can provide valuable insights into the atrial activity and help identify potential abnormalities.
One of the key aspects to assess when analyzing the P-wave is its duration. A normal P-wave duration ranges between 0.08 to 0.12 seconds (80 to 120 milliseconds). P-waves that are abnormally prolonged or shortened may indicate atrial enlargement or conduction abnormalities.
Another important characteristic of the P-wave is its morphology, which refers to the shape and appearance. A normal P-wave has a smooth, rounded appearance and is upright in leads I, II, and aVF. Deviations from these characteristics can suggest underlying cardiac conditions.
For example, a tall and peaked P-wave, often referred to as a “P-pulmonale,” is often seen in conditions such as pulmonary hypertension or right atrial enlargement. On the other hand, a broad and notched P-wave, known as a “P-mitrale,” is associated with left atrial enlargement or mitral valve disease.
Additionally, the presence of abnormal or absent P-waves can indicate atrial fibrillation (AF) or atrial flutter. In AF, there is an irregular and chaotic pattern with no discernible P-waves, as the atria are contracting irregularly. In atrial flutter, there may be a sawtooth pattern of P-waves instead of the normal rounded shape.
It’s important to note that while a well-defined and normal P-wave is indicative of normal atrial depolarization, it does not guarantee normal atrial function. Further evaluation of the atria’s electrical conduction and response to various stimuli may be required to assess overall atrial health.
By carefully analyzing the morphology and duration of the P-wave on an EKG strip, healthcare professionals can gather vital information about atrial activity. This information, combined with other EKG findings and clinical history, can aid in diagnosing and managing various conditions, such as atrial enlargement, conduction abnormalities, and rhythm disturbances.
Evaluating the PR Interval
The PR interval is an important measurement on an EKG strip that reflects the time it takes for an electrical impulse to travel from the atria to the ventricles. It provides valuable information about the conduction system of the heart and can help in identifying potential abnormalities.
The PR interval begins at the start of the P-wave and ends at the beginning of the QRS complex. The normal range for the PR interval is typically between 0.12 and 0.20 seconds (120 to 200 milliseconds). An abnormally prolonged PR interval (> 0.20 seconds) may suggest a delay in atrioventricular (AV) conduction, such as in conditions like first-degree AV block or atrioventricular nodal (AVN) block.
Conversely, a shortened PR interval (< 0.12 seconds) may indicate accelerated AV conduction, which can occur in conditions such as Wolff-Parkinson-White (WPW) syndrome. WPW syndrome is characterized by an accessory pathway that allows electrical impulses to bypass the normal AV conduction system, resulting in a shortened PR interval and a characteristic delta wave on the EKG strip.
It’s important to note that certain factors, such as age, medications, and physiological state, can influence the length of the PR interval. Additionally, variations in PR interval can be seen in individuals with structural heart diseases or conduction system abnormalities.
Assessing the PR interval allows healthcare professionals to evaluate the integrity of the electrical conduction system, ensuring proper coordination between the atria and ventricles. By identifying any delays or accelerations in AV conduction, potential underlying conditions can be diagnosed and appropriate management strategies can be implemented.
However, it’s crucial to consider the PR interval in conjunction with other EKG measurements and clinical findings, as isolated PR interval abnormalities may have different clinical implications in different individuals. Therefore, a comprehensive evaluation of the EKG strip, including the PR interval, in the context of the patient’s clinical history, is necessary for accurate interpretation and decision-making.
Analyzing the QRS Complex
The QRS complex is a crucial component of an EKG strip and represents the electrical depolarization and subsequent contraction of the ventricles. Analyzing the QRS complex provides valuable insights into ventricular activity and can help identify various cardiac conditions.
The QRS complex is typically composed of three waves: Q, R, and S. The duration of the QRS complex is an essential factor to consider when analyzing an EKG strip. A normal QRS complex duration is generally less than 0.12 seconds (120 milliseconds) but can vary depending on factors such as age, sex, and underlying cardiac conditions. An abnormally prolonged QRS complex may indicate conduction abnormalities, such as bundle branch blocks or ventricular hypertrophy.
The QRS complex morphology, or shape, can also provide valuable insights. A normal QRS complex is expected to have an upward (positive) deflection in leads I and II. If the QRS complex is predominantly negative (downward) in these leads, it could suggest an abnormal ventricular activation pattern.
Furthermore, the presence of Q-waves, or initial downward deflections, may indicate myocardial infarction or other myocardial abnormalities. Q-waves that are deep and wider than one small square in duration may suggest an ongoing or previous myocardial infarction.
It’s important to note that the QRS complex can vary in shape and amplitude depending on the lead being observed. For example, in lead aVR, the QRS complex is expected to be predominantly negative. Therefore, it is crucial to determine the significance of QRS complex abnormalities by comparing them to the expected patterns in different leads.
By carefully analyzing the duration and morphology of the QRS complex, healthcare professionals can gain vital insights into ventricular activity and identify potential abnormalities. This information, combined with other EKG findings and clinical history, helps in diagnosing conditions such as bundle branch blocks, ventricular hypertrophy, and myocardial infarction.
However, it’s important to remember that while the QRS complex provides important diagnostic information, it should be evaluated in conjunction with other EKG measurements and the overall clinical picture for accurate interpretation.
Assessing the ST Segment
The ST segment is a critical component of an EKG strip and represents the time between ventricular depolarization and repolarization. Analyzing the ST segment is crucial for identifying potential myocardial ischemia and other cardiac abnormalities.
The ST segment is typically a flat, isoelectric line that follows the QRS complex and precedes the T-wave. Deviations from the baseline in the ST segment can indicate cardiac abnormalities. When evaluating the ST segment, healthcare professionals pay attention to two main characteristics: elevation and depression.
ST segment elevation can be a sign of myocardial injury or acute myocardial infarction (AMI). In AMI, the ST segment is elevated above the baseline in the leads facing the affected area of the heart. This elevation is often accompanied by other changes, such as Q-waves and T-wave inversion, and can indicate the severity and location of the myocardial infarction.
On the other hand, ST segment depression can suggest myocardial ischemia, where there is insufficient blood supply to the heart muscle. Myocardial ischemia can be caused by conditions such as coronary artery disease or cardiac stress. The magnitude and duration of ST segment depression can help guide the diagnosis and management of myocardial ischemia.
It’s important to note that non-cardiac factors, such as electrolyte imbalances, medications, and digitalis effect, can also cause ST segment changes. Therefore, it is vital to consider the clinical context and thoroughly evaluate the EKG strip, taking into account other findings and patient history.
Assessing the ST segment is an integral part of EKG interpretation, as it helps in diagnosing myocardial ischemia and acute myocardial infarctions. Early recognition of these conditions is crucial for prompt intervention and successful patient outcomes.
Remember, accurate evaluation of the ST segment requires expertise and careful consideration of other EKG measurements, clinical history, and patient symptoms.
Interpreting the T-Wave
The T-wave is a significant component of an EKG strip and represents the repolarization of the ventricles. Analyzing the T-wave can provide valuable insights into the recovery and relaxation phase of the cardiac cycle, as well as potential cardiac abnormalities.
A normal T-wave is typically a rounded and upright waveform following the QRS complex. However, variations in T-wave morphology can occur due to individual differences and other factors. Therefore, it is essential to consider the context and compare T-wave findings to the baseline characteristics of the patient.
One of the key aspects in interpreting the T-wave is its symmetry. A symmetrical T-wave suggests a healthy repolarization process. However, an asymmetrical or inverted T-wave can indicate underlying cardiac abnormalities, such as myocardial ischemia, electrolyte imbalances, or medication side effects. Inverted T-waves are not necessarily pathological in all cases, especially if they are consistent with the baseline pattern of the patient or seen in specific leads.
The amplitude of the T-wave is another important factor in interpretation. An abnormally tall or peaked T-wave, known as a “hyperacute T-wave,” can be an early sign of myocardial infarction or myocardial injury. Conversely, a low-amplitude or flattened T-wave can indicate various conditions such as myocardial ischemia, electrolyte abnormalities, or medication effects.
It’s worth noting that T-wave abnormalities can also be non-cardiac in origin. Factors such as electrolyte imbalances, intracranial events, or medications like digoxin or antiarrhythmics can influence T-wave morphology. Therefore, it’s crucial to assess T-wave abnormalities in the context of the patient’s clinical history and other EKG findings.
By accurately interpreting the T-wave on an EKG strip, healthcare professionals can gain insights into the repolarization phase of the cardiac cycle and identify potential abnormalities. However, it is important to remember that T-wave abnormalities are not diagnostic on their own and must be evaluated in conjunction with other EKG measurements, patient symptoms, and clinical history.
Analyzing the QT Interval
The QT interval is an important measurement on an EKG strip that represents the total duration of ventricular depolarization and repolarization. Analyzing the QT interval can provide valuable insights into the risk of developing potentially life-threatening arrhythmias.
To measure the QT interval accurately, it is crucial to identify the onset of the QRS complex and the end of the T-wave. The QT interval should be measured from the beginning of the QRS complex to the end of the T-wave, including any associated U-wave if present.
The duration of the QT interval can vary depending on various factors such as heart rate and patient characteristics. To account for heart rate, it is common to correct the QT interval using formulas such as the Bazett formula (QTc = QT / √RR), Fridericia formula (QTc = QT / (RR)^(1/3)), or another appropriate correction formula. These corrections help to normalize the QT interval for heart rate, allowing for more accurate comparison and assessment across individuals.
An abnormally prolonged QT interval may indicate a condition known as long QT syndrome (LQTS), which can increase the risk of life-threatening arrhythmias such as torsades de pointes. LQTS can be congenital or acquired, and it is essential to identify and manage this condition to prevent sudden cardiac events.
Conversely, a shortened QT interval may be present in certain conditions, such as hypercalcemia or some genetic disorders. It is important to assess the QT interval in the context of the patient’s clinical history and other EKG findings to determine its significance.
It’s worth noting that medications can also affect the QT interval. Some medications, including certain antibiotics, antipsychotics, and antiarrhythmics, can prolong the QT interval and increase the risk of arrhythmias. Therefore, it is important to consider medication history when assessing the QT interval.
By carefully analyzing the QT interval on an EKG strip and correcting it for heart rate, healthcare professionals can assess the risk of arrhythmias and identify potential concerns such as long QT syndrome. Prompt recognition and appropriate management of QT interval abnormalities are crucial to prevent adverse cardiac events and ensure patient safety.
Remember, when interpreting the QT interval, it is essential to use appropriate correction formulas, consider other EKG measurements, and evaluate the overall clinical context to make accurate assessments and clinical decisions.
Recognizing Abnormalities
Recognizing abnormalities on an EKG strip is an essential skill for healthcare professionals. While each component of an EKG strip provides valuable information, it is the collective analysis of all the features that allows for the identification of potential cardiac abnormalities.
Abnormalities can manifest in various ways on an EKG strip, and it is critical to be vigilant for any deviations from the expected patterns. Here are some common abnormalities to be aware of:
- Absence of waves: The absence of P-waves may indicate atrial fibrillation or atrial flutter, while the absence of QRS complexes may suggest ventricular fibrillation or severe conduction abnormalities.
- Prolonged or shortened intervals: Abnormal PR intervals may indicate atrioventricular (AV) block or conduction disturbances. Prolonged QT intervals can indicate long QT syndrome or medication effects, while shortened QT intervals may suggest hypercalcemia or genetic disorders.
- Irregular rhythms: Irregular patterns, such as atrial fibrillation or ventricular arrhythmias, can indicate underlying cardiac conditions that require further evaluation.
- ST segment changes: ST segment elevation can suggest myocardial infarction, while ST segment depression can indicate myocardial ischemia. These changes may require immediate intervention or further investigation.
- T-wave abnormalities: Inverted or asymmetrical T-waves can be indicative of myocardial ischemia, electrolyte imbalances, medications, or other underlying cardiac conditions.
- Arrhythmias: Various arrhythmias, including atrial fibrillation, ventricular tachycardia, or heart block, may be observed on an EKG strip and require appropriate diagnosis and management.
Recognizing these abnormalities and understanding their potential implications is crucial for providing optimal patient care. Identifying cardiac abnormalities on an EKG strip allows healthcare professionals to initiate timely interventions, refer patients to specialists, adjust medications, or initiate further diagnostic tests as needed.
It is important to remember that EKG interpretation requires knowledge, experience, and attention to detail. EKG findings should be correlated with the patient’s clinical history, symptoms, and other diagnostic tools to ensure accurate diagnosis and appropriate management.
Regular practice, ongoing education, and collaboration with other healthcare professionals are essential for honing EKG interpretation skills and maintaining a high level of proficiency. By improving our ability to recognize abnormalities, we can contribute to better patient outcomes and the early detection of potentially life-threatening cardiac conditions.
Conclusion
Understanding how to read an EKG monitor is a valuable skill for healthcare professionals and anyone interested in cardiac health. By analyzing the components of an EKG strip, such as the P-wave, QRS complex, ST segment, T-wave, and QT interval, healthcare professionals can gain insights into the electrical activity of the heart, identify abnormalities, and make informed decisions regarding patient care.
The EKG monitor provides a visual representation of the electrical events occurring in the heart, allowing for the assessment of heart rate, rhythm, conduction system function, and signs of ischemia or other cardiac abnormalities. It serves as a diagnostic tool, helping healthcare professionals identify conditions such as atrial fibrillation, myocardial infarctions, bundle branch blocks, or long QT syndrome.
However, it is important to approach EKG interpretation with caution and in conjunction with the patient’s clinical history, symptoms, and other diagnostic tests. Each EKG finding should be assessed within the context of the patient’s overall health to ensure accurate diagnosis and appropriate management.
To become skilled in EKG interpretation, ongoing practice, education, and collaboration with colleagues are essential. Regularly reviewing EKG strips, staying up-to-date with current guidelines and research, and seeking opportunities for continued professional development can help healthcare professionals refine their skills and enhance patient care.
In conclusion, EKG interpretation is a valuable tool for assessing cardiac health and diagnosing various conditions. By understanding the components of an EKG strip and analyzing them systematically, healthcare professionals can provide effective care and make informed decisions regarding patient management. The ability to recognize abnormalities, understand their significance, and correlate them with the patient’s clinical history is crucial for accurate interpretation and optimal patient outcomes.