Introduction
Safari, Apple's widely used web browser, offers a powerful tool known as the Inspector, which allows users to delve into the inner workings of web pages. Whether you're a web developer, designer, or simply a curious user, the Inspector can provide valuable insights into the structure, layout, and functionality of websites. By understanding how to use the Inspector effectively, you can gain a deeper understanding of web development and design, and even troubleshoot issues that may arise while browsing the web.
In this article, we will explore the various features of the Inspector in Safari, guiding you through its different tabs and demonstrating how each can be utilized to analyze and manipulate web content. From inspecting and modifying HTML elements to examining network activity and debugging JavaScript, the Inspector offers a wide array of tools to aid in understanding and enhancing the web browsing experience.
Whether you're looking to customize the appearance of a webpage, optimize its performance, or gain insights into its underlying code, the Inspector in Safari is a versatile and indispensable tool. By the end of this article, you will have a comprehensive understanding of how to leverage the Inspector to gain valuable insights into web development and design, empowering you to make the most of your browsing experience.
Opening the Inspector
To begin exploring the powerful capabilities of the Inspector in Safari, you first need to open it. There are several ways to access the Inspector, each providing quick and convenient access to its robust features.
Using the Menu Bar
One of the simplest methods to open the Inspector is through the Safari menu bar. By navigating to the "Develop" menu and selecting "Show Web Inspector," you can swiftly launch the Inspector, ready to delve into the inner workings of any webpage.
Keyboard Shortcuts
For those who prefer to streamline their workflow with keyboard shortcuts, Safari offers a quick and efficient way to open the Inspector. By pressing "Option + Command + I" on a Mac, or "Ctrl + Option + I" on a Windows PC, you can instantly access the Inspector, saving valuable time and effort.
Right-Click Context Menu
Another convenient way to open the Inspector is by right-clicking on any element within a webpage and selecting "Inspect Element" from the context menu. This method allows for immediate inspection of specific elements, making it ideal for targeted analysis and modification.
Using the Address Bar
Safari also provides a direct method to open the Inspector by entering a special command in the address bar. By typing "inspect" or "inspector://" followed by the Enter key, the Inspector will promptly appear, ready for exploration.
Docked Inspector
Once the Inspector is open, it can be docked to the bottom, right, or left of the browser window, providing a customizable layout that suits your preferences. This feature allows for seamless multitasking, as you can simultaneously view the Inspector and the webpage, making it easier to analyze and modify elements in real-time.
By familiarizing yourself with these various methods to open the Inspector, you can seamlessly integrate its powerful capabilities into your web browsing and development workflow. With the Inspector readily accessible, you are well-equipped to embark on a journey of exploration and discovery within the intricate world of web development and design.
Elements Tab
The Elements tab within the Inspector in Safari serves as a gateway to the underlying structure of a web page. Upon opening the Inspector and navigating to the Elements tab, you are presented with a visual representation of the Document Object Model (DOM) of the current webpage. This hierarchical view allows you to inspect and manipulate various elements, providing valuable insights into the composition and layout of the page.
Understanding the DOM Tree
At the core of the Elements tab lies the DOM tree, which organizes the HTML elements of the webpage in a nested structure. Each HTML element, such as headings, paragraphs, images, and more, is represented as a node within the tree. By expanding and collapsing nodes, you can navigate through the DOM tree to locate specific elements and understand their relationships to one another.
Inspecting Elements
The Inspector empowers you to inspect individual elements within the DOM, revealing a wealth of information about each element. By hovering over elements in the Inspector or on the webpage itself, you can visually highlight the corresponding elements, making it easier to identify and select specific components for further analysis.
Modifying Attributes and Styles
One of the most powerful features of the Elements tab is the ability to modify attributes and styles of HTML elements in real-time. By double-clicking on an element's attributes or styles, you can directly edit them within the Inspector, instantly observing the visual changes on the webpage. This dynamic editing capability is invaluable for experimenting with different design and layout modifications without altering the actual source code.
Event Listeners
In addition to visual and structural inspection, the Elements tab provides insights into event listeners attached to various elements. This feature is particularly useful for understanding the interactivity and functionality of a webpage, as it allows you to view and manage event listeners associated with specific elements.
Accessibility and Validation
Furthermore, the Inspector in Safari includes accessibility and validation tools within the Elements tab, enabling you to assess the accessibility of elements and validate the HTML structure for compliance with web standards. This functionality is essential for ensuring that web content is accessible to all users and adheres to best practices in web development.
By mastering the Elements tab in the Inspector, you gain the ability to dissect and manipulate the building blocks of web pages, fostering a deeper understanding of web development and design. Whether you're fine-tuning the layout, debugging issues, or optimizing accessibility, the Elements tab equips you with the tools to navigate the intricate web of HTML elements with confidence and precision.
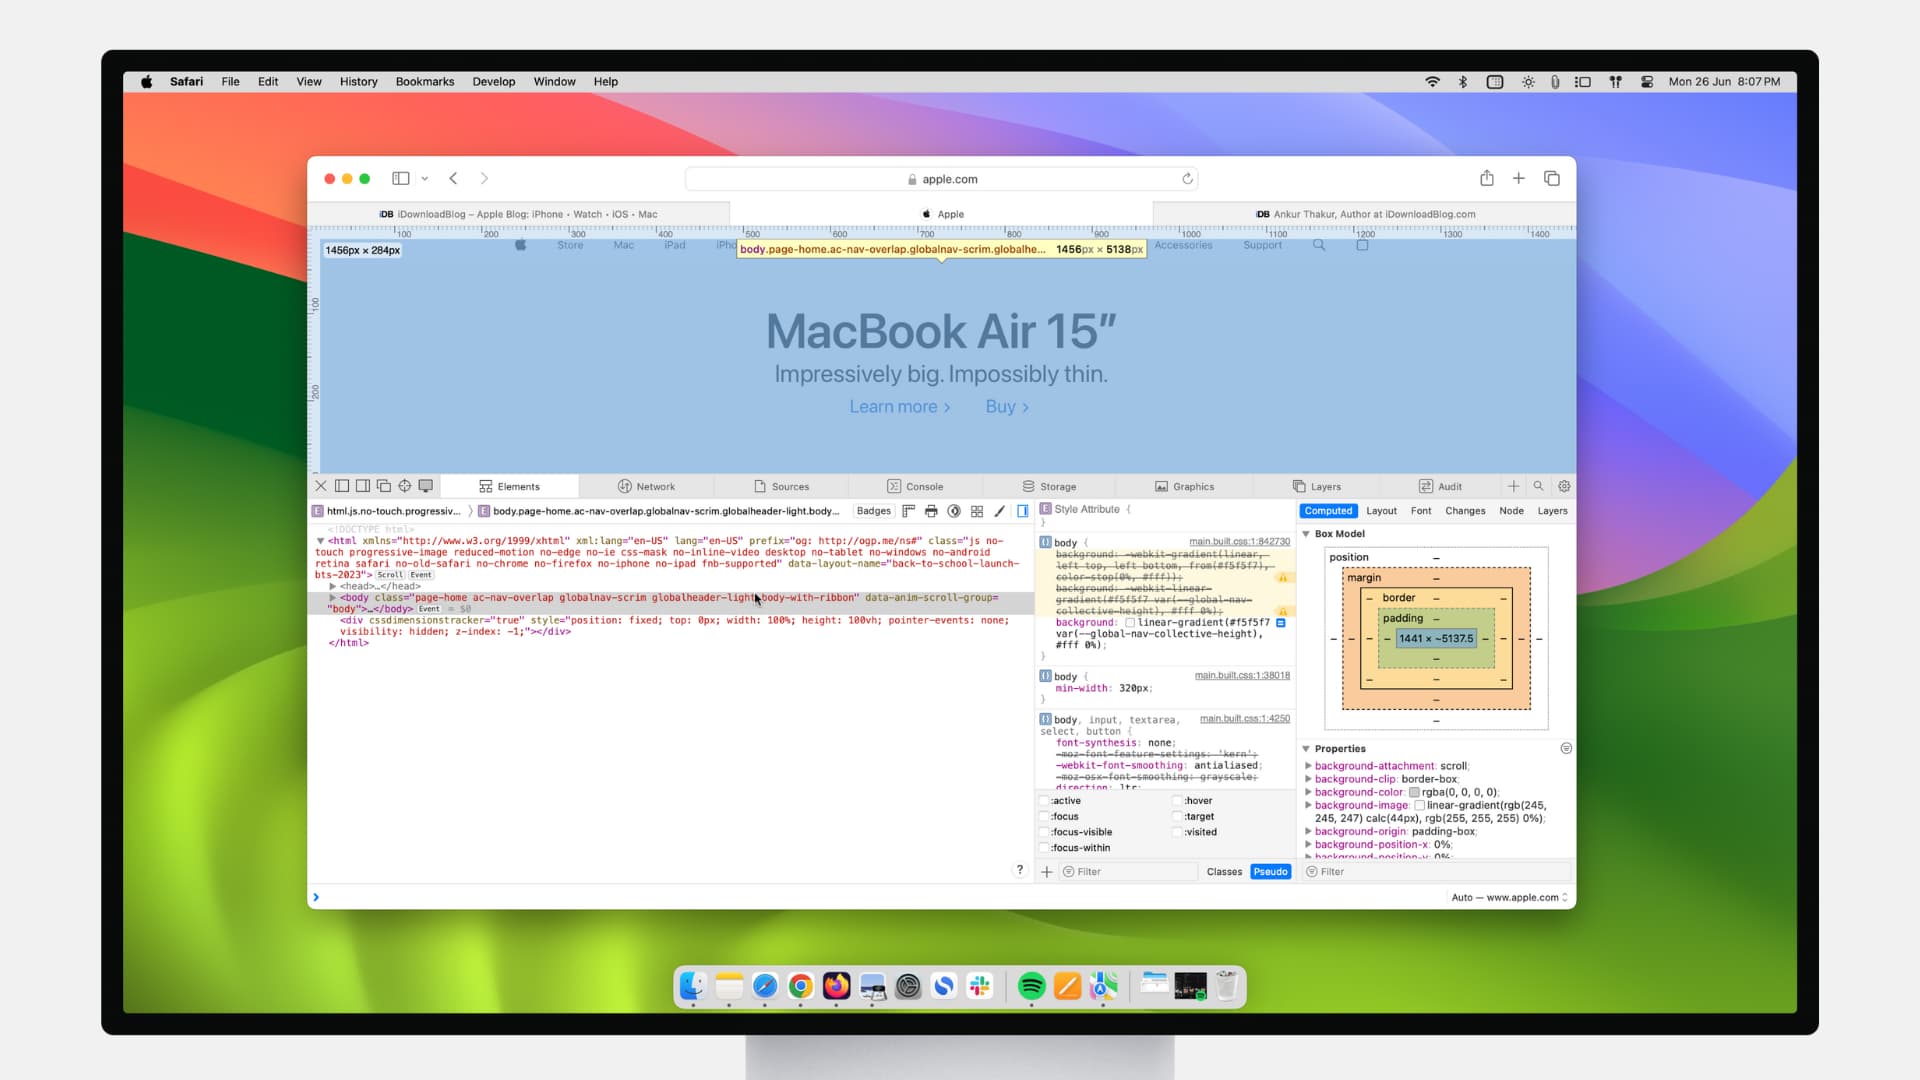
Styles Tab
The Styles tab, a pivotal component of the Inspector in Safari, serves as a gateway to the visual presentation and styling of a web page. Upon navigating to the Styles tab within the Inspector, you are greeted with a comprehensive overview of the CSS (Cascading Style Sheets) rules that define the appearance and layout of the current webpage. This powerful tool provides invaluable insights into the styling hierarchy, inheritance, and applied styles, empowering you to analyze, modify, and optimize the visual aspects of web content.
Comprehending the Style Rules
At the heart of the Styles tab lies a detailed display of CSS rules that dictate the appearance of elements on the webpage. Each rule encompasses selectors, properties, and values, collectively shaping the visual presentation of the content. By examining these rules, you can gain a profound understanding of how styles are applied and inherited throughout the DOM, unraveling the intricacies of the cascading nature of CSS.
Visualizing Box Model and Layout
The Styles tab offers a visual representation of the box model for selected elements, illustrating the dimensions, padding, borders, and margins that define the layout of each element. This feature provides a clear and intuitive depiction of the spatial attributes of elements, facilitating precise adjustments to the layout and spacing without the need to decipher complex CSS code.
Modifying Styles in Real-Time
One of the most compelling capabilities of the Styles tab is the ability to modify CSS styles directly within the Inspector, observing instantaneous visual updates on the webpage. By clicking on individual style properties, you can alter their values, experiment with different design variations, and witness the immediate impact on the layout and appearance of the content. This dynamic editing functionality empowers you to fine-tune the visual presentation of web pages with unparalleled efficiency and precision.
Understanding Computed Styles
In addition to the explicit CSS rules, the Styles tab provides insights into the computed styles of elements, revealing the final, computed values of all CSS properties. This feature is instrumental in understanding how styles are resolved and applied to elements, shedding light on the intricate process of style computation and inheritance within the DOM.
Optimizing Performance and Responsiveness
Furthermore, the Styles tab includes tools for analyzing and optimizing the performance and responsiveness of web content. By inspecting and managing styles related to layout and rendering, you can identify opportunities to enhance the speed and efficiency of webpage display, ensuring a seamless and responsive user experience across various devices and screen sizes.
By harnessing the capabilities of the Styles tab within the Inspector, you gain a profound understanding of the visual presentation and styling of web content. Whether you're refining the layout, optimizing performance, or experimenting with design variations, the Styles tab equips you with the tools to navigate the intricate realm of CSS with confidence and finesse.
Resources Tab
The Resources tab in Safari's Inspector serves as a comprehensive resource management tool, offering insights into various aspects of web content, including network activity, storage, and more. Upon navigating to the Resources tab within the Inspector, you gain access to a wealth of information that enables you to analyze, monitor, and optimize the resources utilized by web pages.
Resource Overview
The Resources tab provides a holistic overview of the resources loaded by the current webpage, encompassing a wide range of elements such as documents, stylesheets, scripts, images, fonts, and more. This comprehensive view allows you to understand the composition of resources that contribute to the rendering and functionality of the webpage, providing valuable insights into the underlying assets that shape the user experience.
Network Requests
One of the key features of the Resources tab is the network request log, which meticulously records all HTTP requests initiated by the webpage. This log includes details such as request and response headers, timing, and resource size, enabling you to assess the performance and efficiency of network requests. By analyzing the network activity, you can identify potential bottlenecks, optimize resource loading, and ensure swift and seamless delivery of content to users.
Storage and Caching
In addition to network activity, the Resources tab offers visibility into various forms of storage utilized by web pages, including cookies, local and session storage, and application caches. This feature allows you to monitor and manage the storage of data, ensuring compliance with privacy regulations and optimizing the utilization of storage resources for enhanced user experience.
Initiating and Analyzing XHR/Fetch Requests
The Resources tab facilitates the inspection and analysis of XMLHttpRequest (XHR) and Fetch requests made by web pages, providing detailed insights into the data exchanged between the client and server. By monitoring XHR and Fetch requests, you can troubleshoot data retrieval and transmission issues, validate response data, and ensure the seamless operation of dynamic web applications.
Performance Analysis
Furthermore, the Resources tab includes tools for performance analysis, enabling you to assess the loading times of individual resources, identify potential performance bottlenecks, and optimize the delivery of content for enhanced user experience. This functionality is instrumental in fine-tuning the performance of web pages, ensuring swift and efficient resource loading across diverse network conditions and devices.
By leveraging the capabilities of the Resources tab within the Inspector, you gain a comprehensive understanding of the resources utilized by web pages, empowering you to optimize network activity, storage, and performance for an unparalleled user experience. Whether you're analyzing network requests, managing storage, or fine-tuning performance, the Resources tab equips you with the tools to navigate the intricate realm of web resources with precision and efficiency.
Network Tab
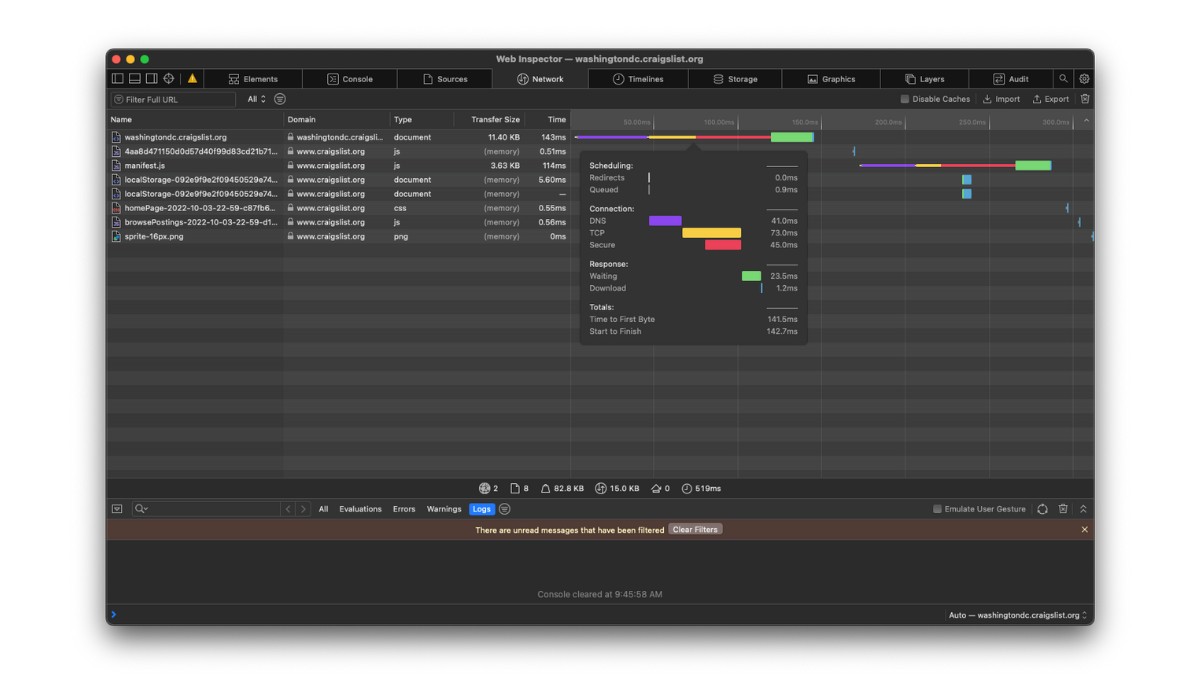
The Network tab within Safari's Inspector is a vital tool for analyzing the network activity of web pages, providing valuable insights into the loading and transmission of resources. Upon navigating to the Network tab, you gain access to a comprehensive log of network requests initiated by the webpage, along with detailed information about each request and response.
Monitoring Network Activity
The Network tab meticulously records all network requests, including HTTP requests for documents, stylesheets, scripts, images, and other resources. Each request is accompanied by essential details such as request and response headers, timing, resource size, and the initiator responsible for the request. This comprehensive log allows you to monitor the sequence and performance of network requests, enabling you to identify potential bottlenecks and optimize resource loading.
Request and Response Details
By selecting individual network requests in the log, you can delve into the specifics of each request and response. This includes insights into request headers, response headers, status codes, and response content, providing a granular understanding of the data exchange between the client and server. Analyzing these details allows you to troubleshoot issues related to resource loading, validate response data, and ensure the efficient delivery of content to users.
Performance Analysis and Timing
The Network tab offers tools for performance analysis, allowing you to assess the loading times of individual resources and the overall timeline of network activity. By examining the timing of network requests, you can pinpoint potential performance bottlenecks, optimize resource loading, and ensure swift and efficient delivery of content. This functionality is instrumental in fine-tuning the performance of web pages, ensuring a seamless user experience across diverse network conditions.
Filtering and Sorting Capabilities
To streamline the analysis of network activity, the Network tab provides filtering and sorting capabilities, enabling you to focus on specific types of requests or isolate requests based on various criteria. This feature empowers you to efficiently identify and address issues related to resource loading, network latency, and content delivery, fostering a responsive and optimized web browsing experience.
Initiating XHR/Fetch Requests
In addition to monitoring network requests initiated by the webpage, the Network tab facilitates the inspection and analysis of XMLHttpRequest (XHR) and Fetch requests. This feature provides detailed insights into the data exchanged between the client and server, allowing for thorough validation of response data and troubleshooting of dynamic web application functionality.
By harnessing the capabilities of the Network tab within the Inspector, you gain a comprehensive understanding of the network activity of web pages, empowering you to optimize resource loading, troubleshoot performance issues, and ensure seamless content delivery. Whether you're analyzing network requests, fine-tuning performance, or validating response data, the Network tab equips you with the tools to navigate the intricate realm of network activity with precision and efficiency.
Console Tab
The Console tab within Safari's Inspector serves as a dynamic interface for interacting with the JavaScript console of web pages, offering a powerful set of tools for debugging, logging, and executing JavaScript code. Upon navigating to the Console tab, you gain access to a versatile environment that enables you to monitor runtime errors, log messages, inspect JavaScript objects, and execute ad-hoc scripts, providing invaluable insights into the behavior and functionality of web applications.
Error Logging and Debugging
One of the primary functions of the Console tab is to capture and display runtime errors and exceptions encountered by JavaScript code within the webpage. By monitoring the console output, you can swiftly identify and address errors, ensuring the smooth operation of web applications. Additionally, the console provides detailed stack traces and contextual information for each error, facilitating thorough debugging and troubleshooting of JavaScript code.
Logging Messages and Variables
The Console tab allows for the logging of custom messages, variables, and objects, providing a means to track the execution flow and state of JavaScript code. By utilizing the console.log() method, you can output informative messages and inspect the values of variables and objects at specific points in the code, enabling you to gain visibility into the internal workings of web applications and pinpoint potential issues.
Interactive JavaScript Execution
In addition to logging and debugging, the Console tab offers an interactive environment for executing JavaScript code directly within the Inspector. This feature allows you to experiment with JavaScript expressions, test functions, and manipulate objects in real-time, fostering a dynamic and exploratory approach to understanding and modifying the behavior of web applications.
Network Request Monitoring
Furthermore, the Console tab provides visibility into network requests and responses, allowing you to monitor the exchange of data between the client and server. By capturing network-related messages and errors, you can assess the performance and integrity of data transmission, troubleshoot connectivity issues, and validate the handling of network requests within web applications.
Performance Profiling
Moreover, the Console tab includes tools for performance profiling, enabling you to analyze the execution time and memory usage of JavaScript code. By leveraging the built-in profiling capabilities, you can identify performance bottlenecks, optimize code efficiency, and ensure the responsive and efficient operation of web applications.
By harnessing the capabilities of the Console tab within the Inspector, you gain a comprehensive understanding of JavaScript runtime behavior, empowering you to debug, log, and execute JavaScript code with precision and agility. Whether you're troubleshooting errors, monitoring network activity, or profiling performance, the Console tab equips you with the tools to navigate the intricate realm of JavaScript development with confidence and insight.
Conclusion
In conclusion, the Inspector in Safari is a multifaceted and indispensable tool that empowers users to delve into the inner workings of web pages, gaining valuable insights into web development and design. By exploring the various tabs of the Inspector, including Elements, Styles, Resources, Network, and Console, users can unravel the complexities of web content, optimize performance, troubleshoot issues, and gain a deeper understanding of the technologies that drive the modern web.
The Elements tab provides a window into the hierarchical structure of web pages, allowing users to inspect, manipulate, and validate HTML elements with precision. From understanding the Document Object Model (DOM) to modifying attributes and styles in real-time, the Elements tab equips users with the tools to dissect and fine-tune the building blocks of web content.
Moving on to the Styles tab, users can gain a comprehensive understanding of the visual presentation and styling of web pages. By analyzing CSS rules, visualizing the box model, and modifying styles on the fly, the Styles tab facilitates the optimization of layout, performance, and design, empowering users to craft visually compelling and responsive web experiences.
The Resources and Network tabs offer invaluable insights into the resources utilized by web pages and the network activity that drives content delivery. From monitoring network requests and performance analysis to managing storage and optimizing resource loading, these tabs provide the tools to ensure swift, efficient, and seamless delivery of web content to users across diverse network conditions and devices.
Finally, the Console tab serves as a dynamic interface for interacting with the JavaScript console, enabling users to log messages, debug errors, execute scripts, and profile performance. This feature-rich environment empowers users to troubleshoot JavaScript code, monitor network activity, and validate the behavior of web applications, fostering a deeper understanding of client-side development and interactivity.
In essence, the Inspector in Safari transcends its role as a mere debugging tool, evolving into a comprehensive suite of features that cater to the diverse needs of web developers, designers, and enthusiasts. By mastering the capabilities of the Inspector, users can navigate the intricate realm of web development and design with confidence, creativity, and precision, ultimately enhancing the quality and user experience of web content across the digital landscape.