To check page loading time in Chrome, open DevTools and use one of three built-in tools: the Performance tab for a full load profile, the Network tab for per-resource timing,...
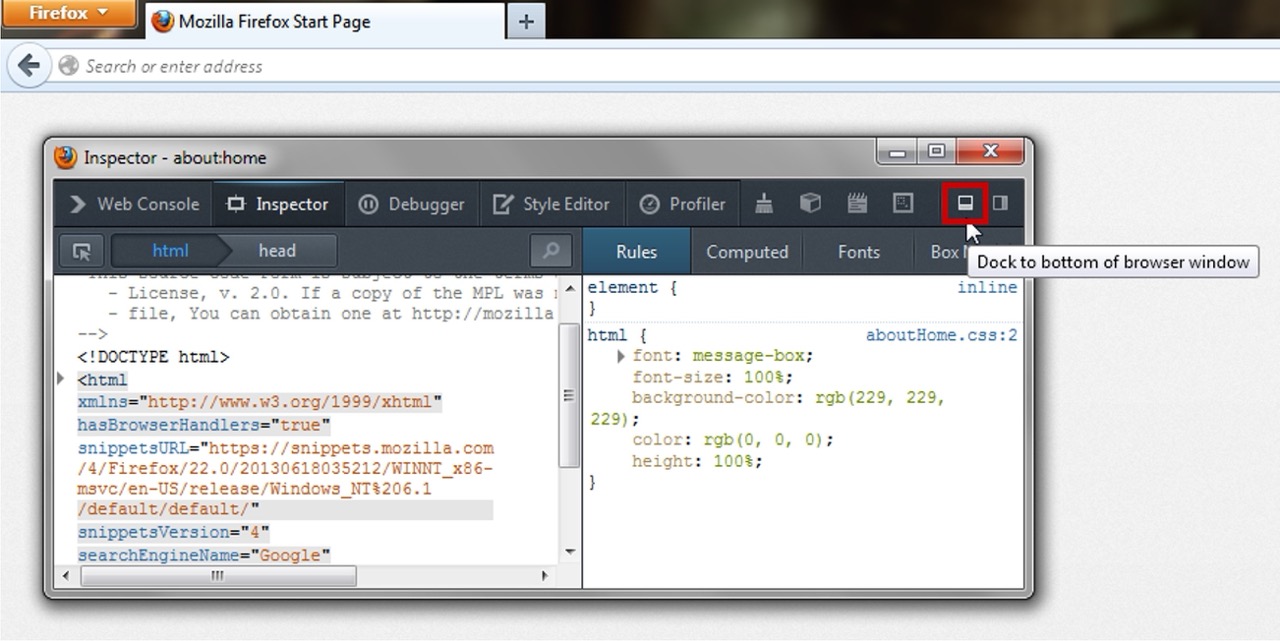
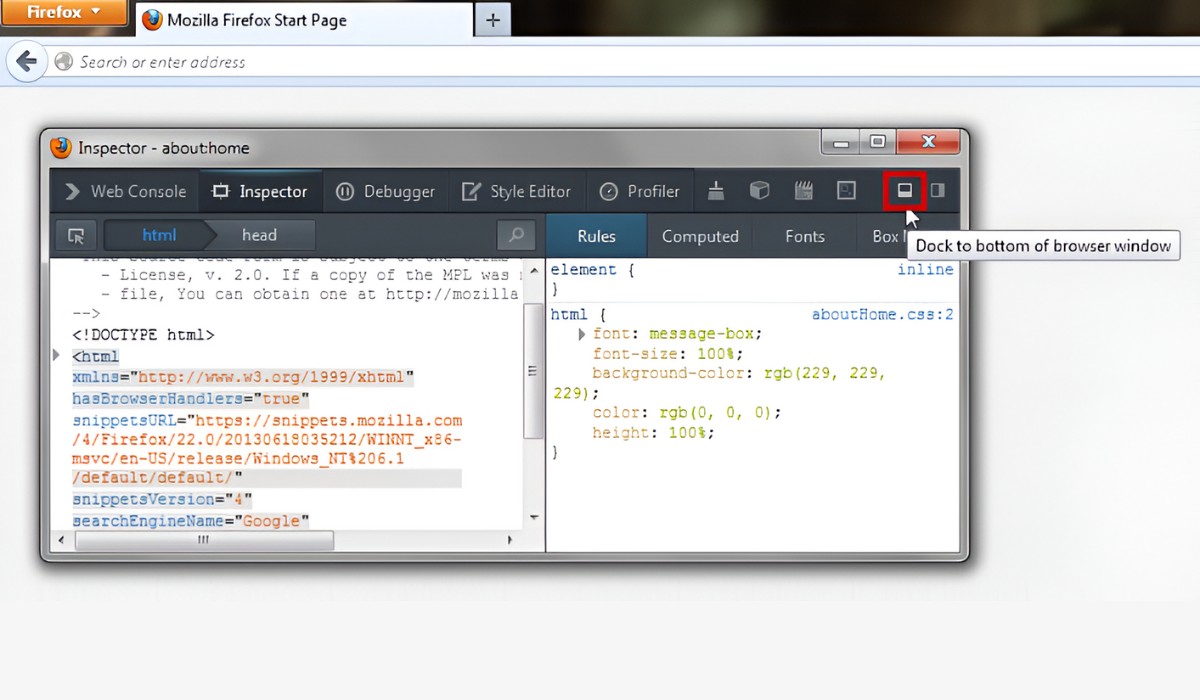
The three quickest ways to open dev tools in Firefox are right-clicking and selecting "Inspect," using a keyboard shortcut, or navigating through the Firefox menu. These methods give you instant...
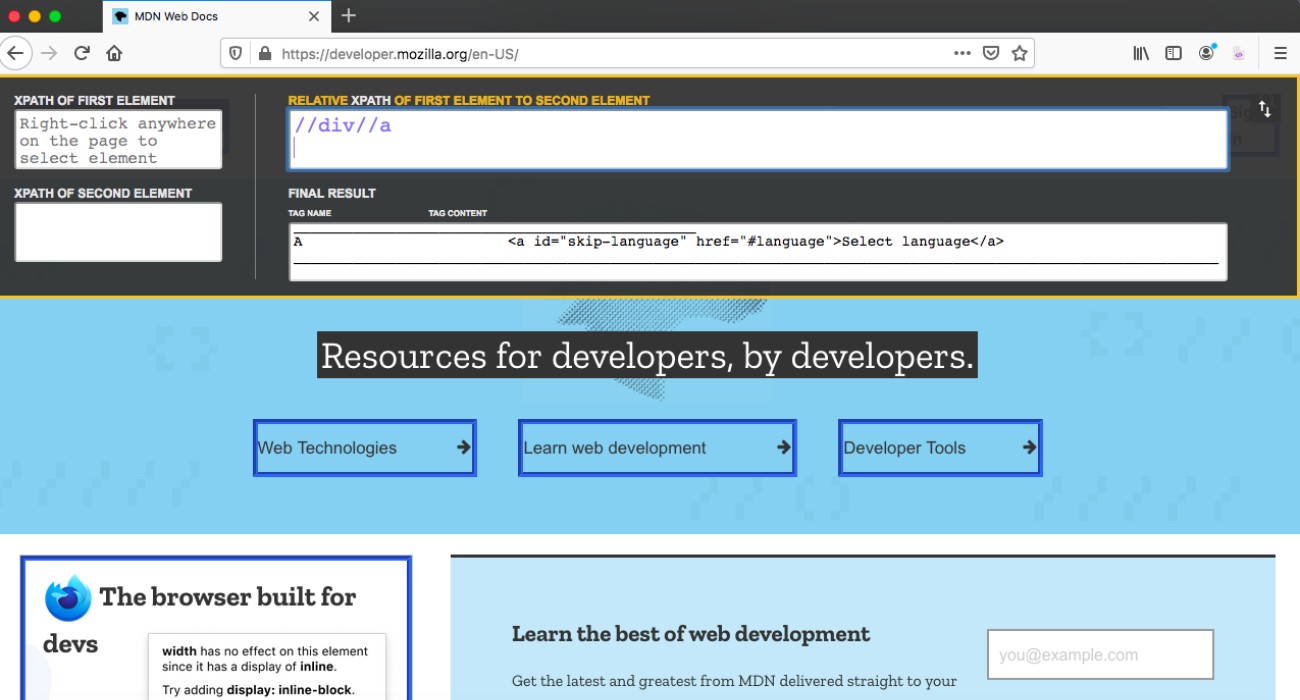
To find an XPath for any element in Firefox, right-click the element on the page and choose "Inspect Element" to open the Developer Tools. Then, right-click the highlighted HTML code...
To open console in Firefox, press Ctrl+Shift+K on Windows/Linux or Cmd+Opt+K on macOS. This instantly opens the Web Console for the current page, giving you direct access to errors, logs,...
To view a React app in the browser, ensure project dependencies are installed, then run the appropriate start command from your project's root directory. This command compiles your code and...
To download the HTML of a website, use your browser's built-in "Save Page As" feature to store the full page source locally, or copy the rendered source from developer tools....
This website uses cookies so that we can provide you with the best user experience possible. Cookie information is stored in your browser and performs functions such as recognising you when you return to our website and helping our team to understand which sections of the website you find most interesting and useful.
Strictly Necessary Cookies
Strictly Necessary Cookie should be enabled at all times so that we can save your preferences for cookie settings.
If you disable this cookie, we will not be able to save your preferences. This means that every time you visit this website you will need to enable or disable cookies again.